A budget calculator turns a list of income and expenses into three numbers that matter: how much is left over, what share of your pay goes to savings, and whether your needs, wants and savings are in balance. Enter your pay in any pay period and your monthly amounts below, and the budget calculator shows the result as you type. It is an income and expenses calculator and a 50 30 20 budget calculator in one, and nothing you enter is sent anywhere.
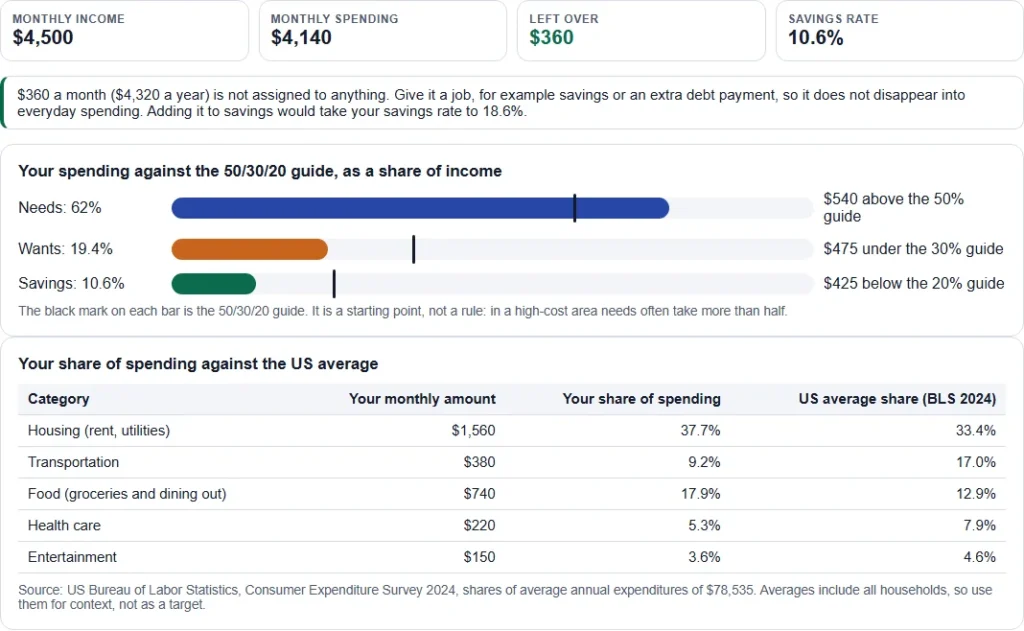
Quick answer: Enter your take-home pay and your monthly expenses. In the example on this page, $4,500 of income and $4,140 of spending leaves $360 a month, a savings rate of 10.6%, with needs at 62.0% of income against the 50/30/20 guide of 50%.
How to use the budget calculator
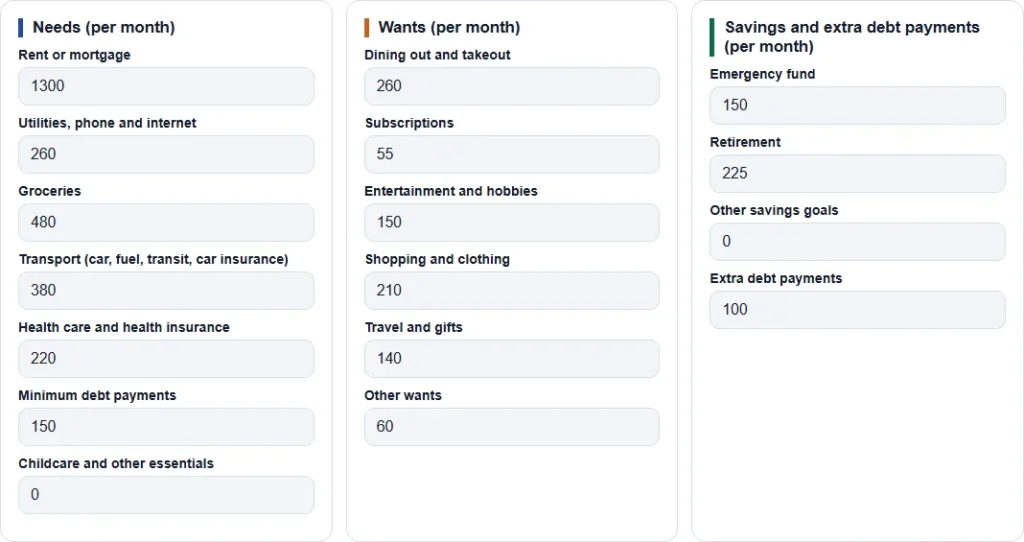
- In the budget calculator, choose how often you are paid and type your take-home pay for that period, after tax. Add any other monthly income, such as side work.
- Fill in the monthly amount for each line of the budget calculator under Needs, Wants and Savings. Leave a line at 0 if it does not apply.
- Read the four tiles for income, spending, what is left over and your savings rate.
- Check the 50/30/20 bars and the table of average US spending, then change a line and watch the result move. Press Print the summary to keep a copy.
Monthly budget calculator: turning any pay period into a monthly income
The monthly budget calculator converts your pay to a monthly figure first, because most bills arrive monthly. It multiplies the pay by the number of pay periods in a year and divides by 12. Multiplying weekly pay by four undercounts, because a year has 52 weeks and a month averages 4.33 of them.
| How you are paid | Pay periods a year | Example pay | Monthly equivalent |
|---|---|---|---|
| Weekly | 52 | $500 | $2,166.67 |
| Every two weeks | 26 | $1,000 | $2,166.67 |
| Twice a month | 24 | $2,000 | $4,000.00 |
| Monthly | 12 | $4,500 | $4,500.00 |
| Yearly | 1 | $60,000 | $5,000.00 |
Two months of the year contain a third paycheck for people paid every two weeks. The calculator uses the average, so plan how you will spend those extra paychecks separately.
What the budget calculator works out from your income
This is a budget calculator based on income: every share it shows is a percentage of your take-home pay.
- Left over is monthly income minus all the amounts you entered. A negative number means you plan to spend more than you earn.
- Savings rate is the amount in the savings group (emergency fund, retirement, other goals and extra debt payments) divided by income.
- Needs, wants and savings shares are each group divided by income, shown against the 50/30/20 guide of 50%, 30% and 20%, with the gap in dollars.
- Share of spending compares your housing, transport, food, health care and entertainment with the US average from the Bureau of Labor Statistics.
The percentages are shares of take-home pay, so they add up to 100% only when nothing is left over. If you want a sheet to write on instead, use the budget planner printable, which has the same structure on paper.
50 30 20 budget calculator example: ,500 a month
| Line | Monthly amount | Group |
|---|---|---|
| Rent or mortgage | $1,300 | Needs |
| Utilities, phone and internet | $260 | Needs |
| Groceries | $480 | Needs |
| Transport | $380 | Needs |
| Health care and health insurance | $220 | Needs |
| Minimum debt payments | $150 | Needs |
| Dining out and takeout | $260 | Wants |
| Subscriptions | $55 | Wants |
| Entertainment and hobbies | $150 | Wants |
| Shopping and clothing | $210 | Wants |
| Travel and gifts | $140 | Wants |
| Other wants | $60 | Wants |
| Emergency fund | $150 | Savings |
| Retirement | $225 | Savings |
| Extra debt payments | $100 | Savings |
| Result | Amount | Share of income | 50/30/20 guide | Difference |
|---|---|---|---|---|
| Needs | $2,790 | 62.0% | $2,250 | +$540 |
| Wants | $875 | 19.4% | $1,350 | -$475 |
| Savings and extra debt | $475 | 10.6% | $900 | -$425 |
| Left over | $360 | 8.0% | – | – |
This household spends $2,790 on needs, 62.0% of income against a guide of 50%, because rent and utilities are heavy. Wants sit well under the 30% guide, and savings reach 10.6%. The $360 left over is not assigned to anything. Moving it to savings would lift the savings rate from 10.6% to 18.6%.
The point of the check is not to hit 50/30/20 exactly. It shows where the budget differs from the guide, so you can decide whether the difference is a choice or a leak.
Which line is worth trimming first
A 10% cut on a big line can save more than a 50% cut on a small one. This table takes every line from the example above and shows what a 10% cut would free up each month:
| Line | Monthly amount | A 10% cut frees | Over a year |
|---|---|---|---|
| Rent or mortgage | $1,300 | $130 | $156 |
| Groceries | $480 | $48 | $58 |
| Transport | $380 | $38 | $46 |
| Utilities, phone and internet | $260 | $26 | $31 |
| Dining out and takeout | $260 | $26 | $31 |
| Health care and health insurance | $220 | $22 | $26 |
| Shopping and clothing | $210 | $21 | $25 |
| Minimum debt payments | $150 | $15 | $18 |
Rent is the biggest lever, but also the hardest to change quickly. The wants lines are smaller yet far easier to move this month. Dining out, shopping and travel together are $610 a month, so a 20% cut there frees $122, almost as much as a 10% cut to rent ($130).
| If wants are cut by | Monthly amount freed | New left over | Savings rate if all goes to savings |
|---|---|---|---|
| 10% | $88 | $448 | 20.5% |
| 20% | $175 | $535 | 22.4% |
| 30% | $262 | $622 | 24.4% |
How your spending compares with the average US household
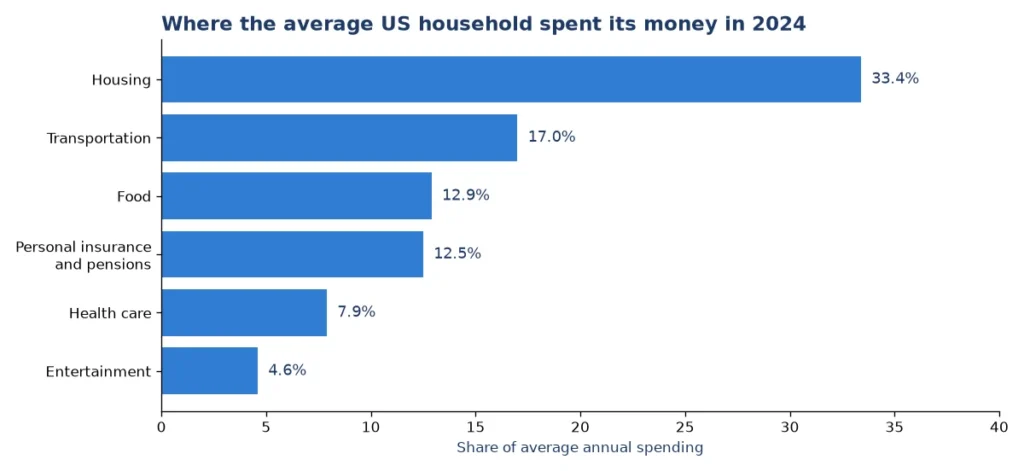
The US Bureau of Labor Statistics Consumer Expenditure Survey reported average spending of $78,535 a year for US households in 2024, which is about $6,545 a month. The largest categories were:
| Category | Share of spending | Average a year | Average a month |
|---|---|---|---|
| Housing | 33.4% | $26,266 | $2,189 |
| Transportation | 17.0% | $13,318 | $1,110 |
| Food | 12.9% | $10,169 | $847 |
| Personal insurance and pensions | 12.5% | $9,797 | $816 |
| Health care | 7.9% | $6,197 | $516 |
| Entertainment | 4.6% | $3,609 | $301 |
| Cash contributions | 2.9% | $2,292 | $191 |
| Apparel and services | 2.5% | $2,001 | $167 |
These are averages across all households, including renters and owners, singles and families, so they describe a typical mix, not a target. The calculator compares your housing (rent and utilities), transport, food, health care and entertainment lines with these shares of spending. Average income before taxes in the same survey was $104,207, so the average household spent about 75% of its pre-tax income.
Income and expenses calculator: what to do when you are over budget
If spending is higher than income, the calculator shows the gap per month and per year. Work through it in this order:
- Check that each number is a real monthly figure. Annual bills such as insurance should be divided by 12.
- Look at the three biggest lines. Small percentage changes there beat many tiny savings.
- Cut wants first, because they are the easiest to change this month, then look at recurring needs such as insurance and phone plans.
- If you carry debt, run the debt snowball calculator to see how much faster an extra payment clears it.
- Rerun the budget calculator after each change until left over is zero or higher.
Frequently asked questions
6 quick answers
What is the 50/30/20 rule?
It splits take-home pay into 50% for needs, 30% for wants and 20% for savings and debt payments above the minimums. The calculator shows your own split next to it in dollars.
Should I enter gross or take-home pay in the budget calculator?
Take-home pay, the amount that reaches your bank account after tax and deductions. Budgeting from gross pay overstates what you can spend.
How do I include irregular income?
Use the amount you receive in a typical low month as your pay, and treat anything above it as extra for savings or debt.
Where do I put annual bills?
Divide the yearly amount by 12 and add it to the matching line, or to Other wants for gifts and travel. That is how the calculator keeps a monthly view.
Does the calculator include taxes?
No. It starts from take-home pay, so tax is already taken out.
Is this budget calculator free, and is my data stored?
It is free. Your numbers stay in your browser on your device, and nothing is sent to a server.
Related calculators and printables
- Budget planner printable to write the plan on paper
- Debt snowball calculator for paying off several debts
- Bill tracker printable to keep track of due dates and payments
- Expense tracker printable to track what you actually spend
- Savings challenge printable to start the savings line
- Compound interest calculator to see what savings can grow to
- Self-employment tax calculator if you work for yourself
This page gives general information and tools, not financial advice.
Last updated: October 2026.