Log-log graph paper has a logarithmic scale on both axes, so power laws such as y = x² or y = x1.5 plot as straight lines. These free printable log-log graph paper sheets give you 1 to 5 cycles up the page and 1 to 3 cycles across, with the lines placed exactly by logarithms. Pick the cycles and the color, then print the PDF.
Log-log graph paper to print (PDF)
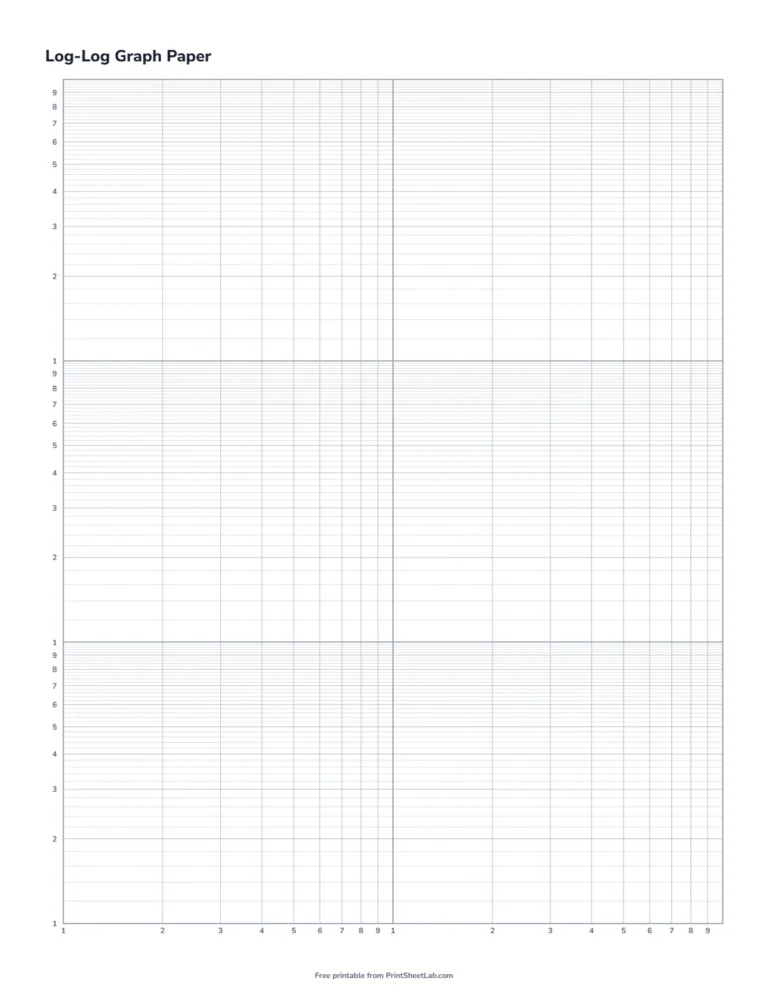
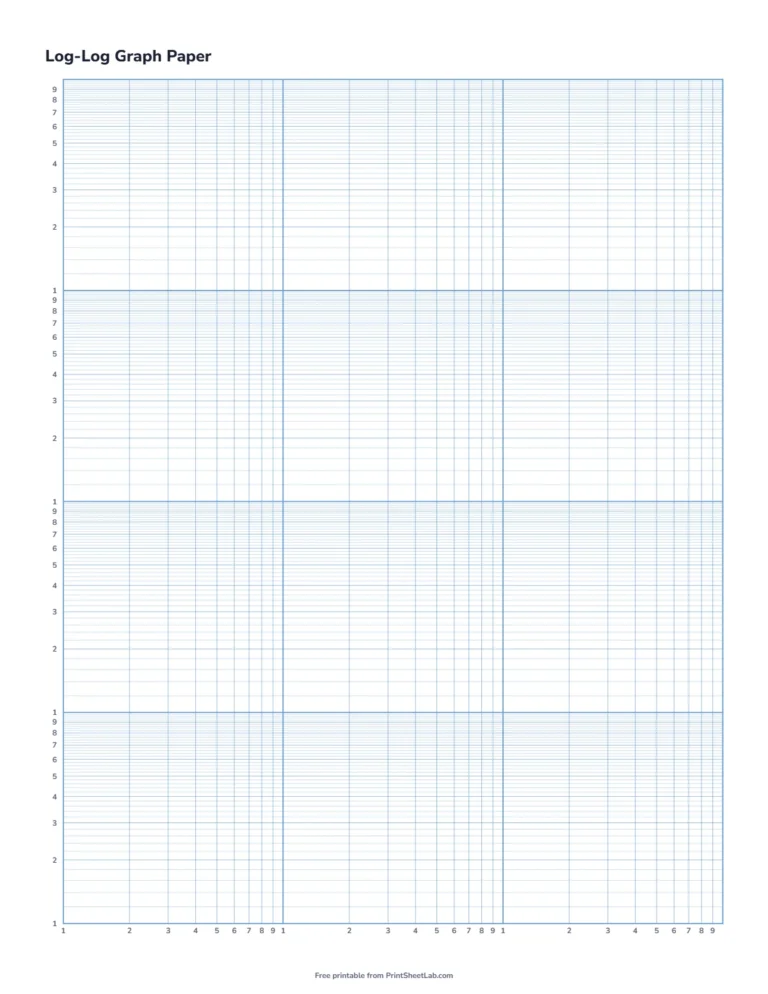
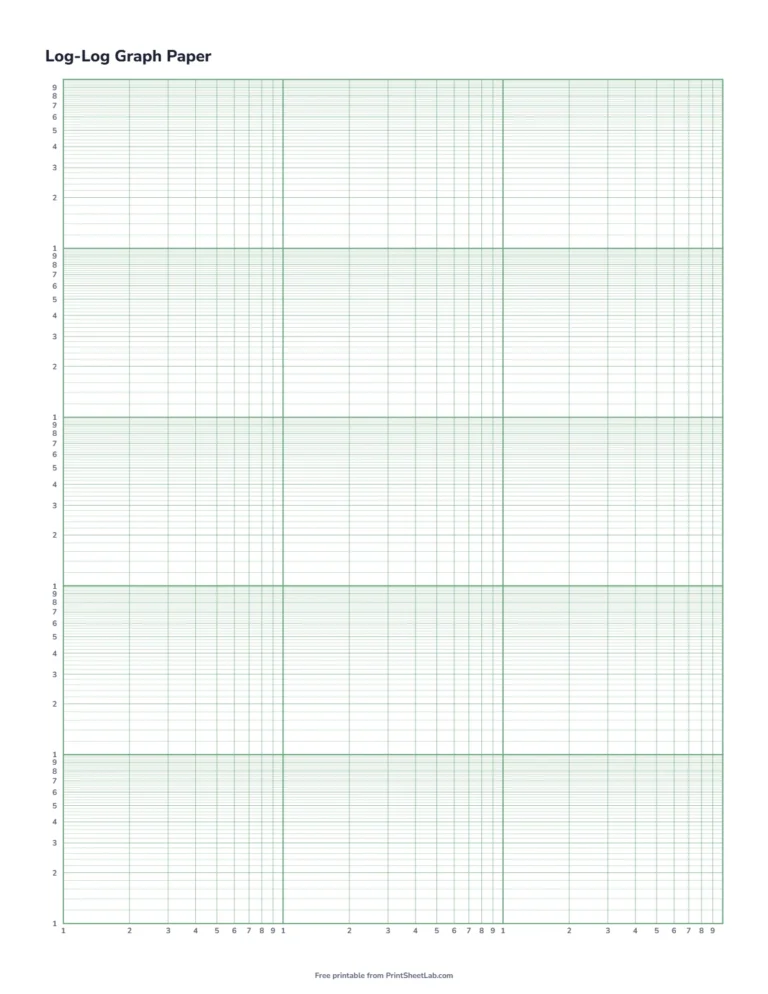
These four pages show the choices: 3 cycles up and 2 across, 4 up and 3 across, 5 up and 3 across, and a worked example that plots the eight planets. Click a picture for the PDF, or use the generator above to choose the cycles and the color.
Logarithmic graph paper on both axes: what is log-log graph paper?
Log-log paper, also called full log graph paper, makes both the horizontal and the vertical scale logarithmic. Each group of lines from 1 to 10 is a cycle, which covers one power of ten. The gaps get narrower as the numbers get larger, so 2 is much farther from 1 than 9 is from 8. Wikipedia describes the idea under power law, and the log-log plot is the usual way to test for one.
Power law graph paper: why a power law is a straight line
If y = a·xn, taking logarithms gives log y = log a + n·log x. That is the equation of a straight line, where the slope is n and the line crosses the vertical axis at log a. So a straight line on log-log paper means your data follows a power law, and the slope tells you the exponent. This table gives some examples you can try:
| Relationship | Exponent n | Straight line slope (cycles up per cycle across) |
|---|---|---|
| Area of a square against its side | 2 | 2 |
| Volume of a cube against its side | 3 | 3 |
| Pendulum period against its length | 0.5 | 0.5 |
| Orbit period against orbit size (Kepler) | 1.5 | 1.5 |
| Metabolic rate against body mass (Kleiber’s law) | about 0.75 | about 0.75 |
| Light brightness against distance | −2 | −2, a line sloping down |
One thing to remember: measure the slope in cycles, not in inches. On these sheets a cycle across is not the same length as a cycle up (for example, 2.43 inches across and 3.11 inches up on a 3 by 3 sheet), so a ruler would give the wrong slope. Count the cycles instead, or use two points: n = log(y₂ ÷ y₁) ÷ log(x₂ ÷ x₁).
Log log graph example: Kepler’s third law
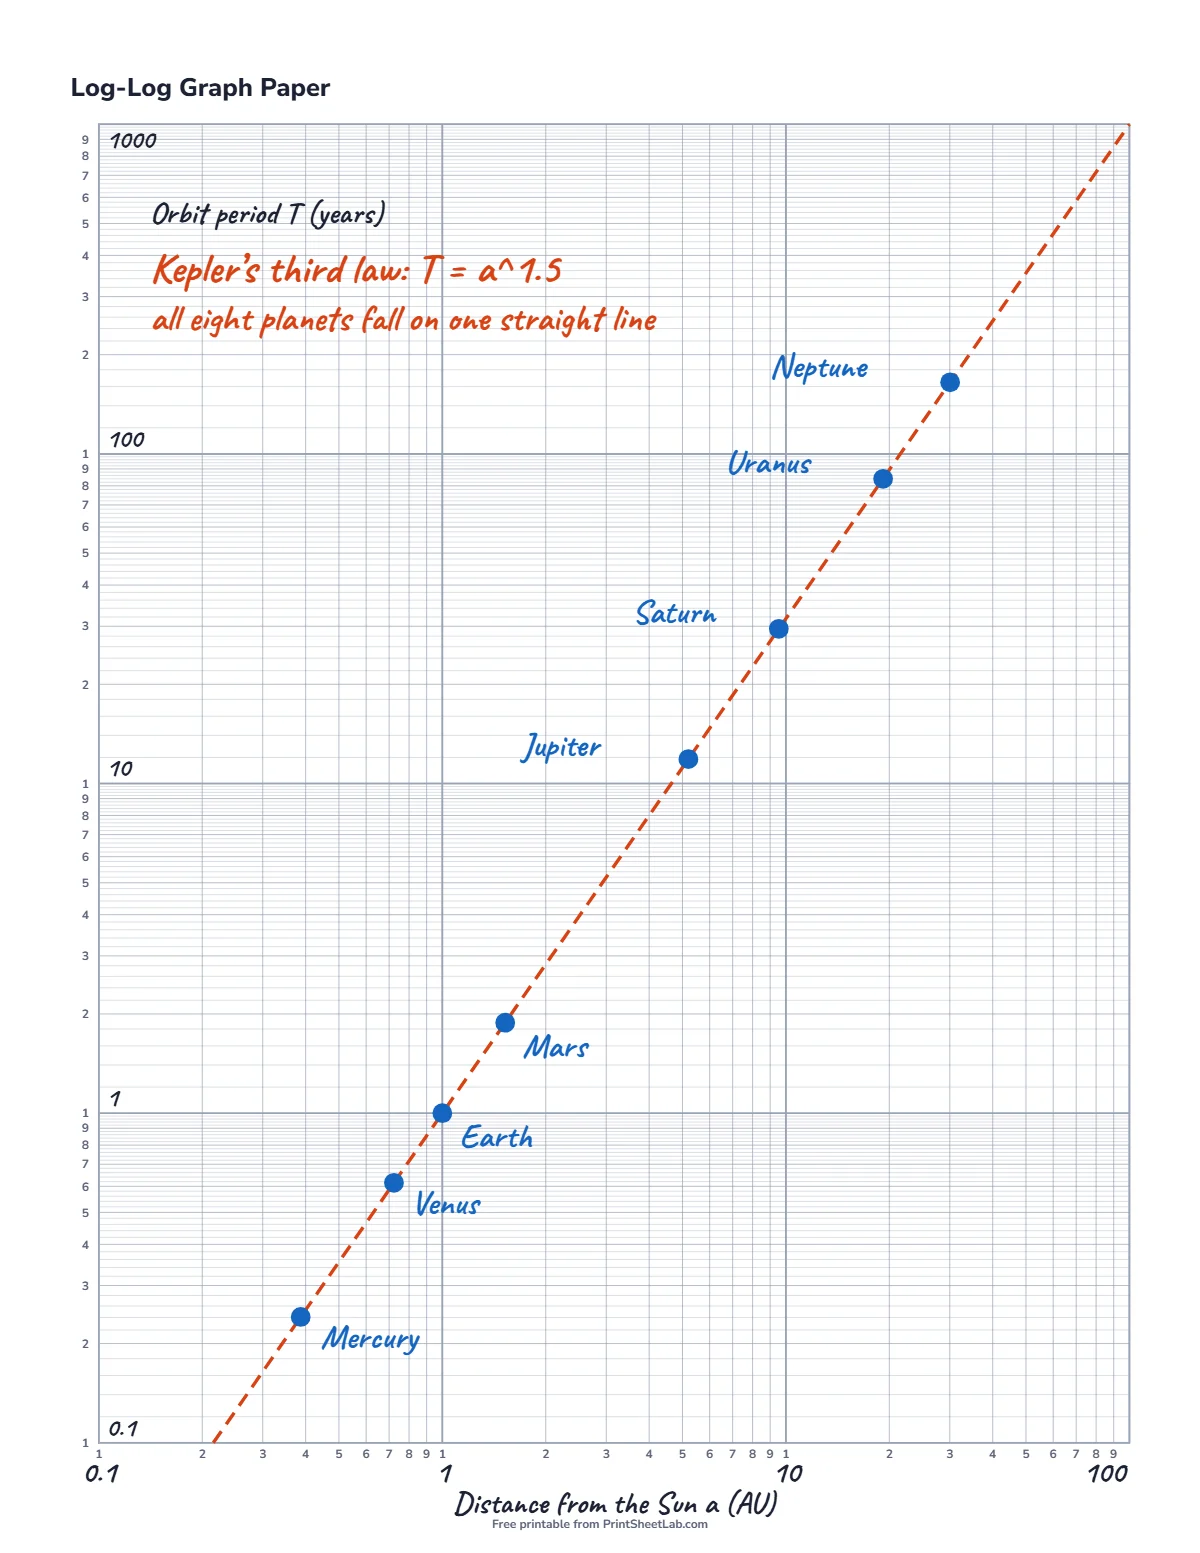
Johannes Kepler found that the square of a planet’s orbit period is proportional to the cube of its distance from the Sun. In symbols, T² = a³ when T is in years and a is in astronomical units (AU). Taking square roots, T = a1.5, so the planets should fall on a line of slope 1.5. The filled example plots these values from the table below, and all eight points lie on the dashed line:
| Planet | Distance a (AU) | Orbit period T (years) | T² ÷ a³ |
|---|---|---|---|
| Mercury | 0.387 | 0.241 | 1.002 |
| Venus | 0.723 | 0.615 | 1.001 |
| Earth | 1.000 | 1.000 | 1.000 |
| Mars | 1.524 | 1.881 | 1.000 |
| Jupiter | 5.203 | 11.86 | 0.999 |
| Saturn | 9.537 | 29.46 | 1.001 |
| Uranus | 19.190 | 84.01 | 0.999 |
| Neptune | 30.070 | 164.80 | 0.999 |
The last column is T² ÷ a³, and it comes out at 1.00 for every planet, within the rounding of the data. Four cycles up cover 0.1 to 1,000 years, and three cycles across cover 0.1 to 100 AU, so a sheet with those settings holds all eight planets.
How many cycles do you need on log log graph paper?
For log log graph paper, look at the smallest and largest value of each variable and count the powers of ten between them. The page is 7.3 inches wide inside the margins and 9.34 inches tall, so the size of each cycle depends on how many you choose:
| Cycles up | Height of one cycle | Cycles across | Width of one cycle |
|---|---|---|---|
| 1 | 9.34 in | 1 | 7.30 in |
| 2 | 4.67 in | 2 | 3.65 in |
| 3 | 3.11 in | 3 | 2.43 in |
| 4 | 2.33 in | — | — |
| 5 | 1.87 in | — | — |
The generator offers 1 to 5 cycles up and 1 to 3 across. A page with 3 cycles across and 4 or 5 cycles up gives the widest range. A page with 1 or 2 cycles across has bigger cycles and is easier to read precisely.
Log-log paper printable: how to plot data on log-log graph paper
- Look at your smallest and largest x and y values and decide where each scale starts. The first line of a cycle can be any power of ten, such as 0.1, 1 or 10.
- Label the thick lines on both axes. Each one is ten times the one before.
- Place each point by its value, not its logarithm. The paper does the logarithm for you.
- Draw the best straight line through the points with a ruler.
- Read the exponent from the slope, and read the constant a from the height of the line where x = 1.
Where full log graph paper is used in other subjects
- Biology: Kleiber’s law relates an animal’s metabolic rate to its body mass, and plots as a line with a slope of about 0.75.
- Physics: the period of a pendulum against its length gives a slope of 0.5, and the inverse-square law for light or gravity gives −2.
- Engineering: filter and amplifier plots, material strength and fatigue data are often drawn on log scales.
- Economics and computing: city sizes, word frequencies and file sizes often follow power laws.
If only the vertical scale needs to be logarithmic, use semi-log graph paper. For plain squares, see graph paper.
Printing tip
Print at 100% or “Actual size” and turn off “Fit to page”, so every measurement on the sheet is exact. Choose Letter or A4 paper in the generator before you download the PDF.
Log-log graph paper: frequently asked questions
How many cycles does log-log graph paper have?
On this generator you can choose 1 to 5 cycles up the page and 1 to 3 cycles across. Each cycle covers one power of ten.
What is the difference between log-log and semi-log graph paper?
Log-log paper has a log scale on both axes and is used for power relationships. Semi-log paper has a log scale on one axis only and is used for exponential growth and decay.
How do I find the exponent from a log-log graph?
Count the cycles the line rises for each cycle it goes across. That ratio is the exponent. A line that rises 2 cycles for every 1 cycle across has the equation y = ax².
Can I print log-log paper in landscape?
The sheet prints in portrait, so the vertical scale has more cycles than the horizontal one. Turn the printed page sideways if your data needs a wider horizontal range.
Is this log-log graph paper free?
Yes. It is free to print for home and classroom use, with no sign-up.
More printable paper
- Specialty paper generator with every layout on this site
- Paper generator for lined, graph, dot grid, isometric and handwriting paper
- Graph paper, lined paper and dot grid paper