A dividend calculator shows how much income a dividend-paying investment produces and what it can grow to over time. This dividend calculator with DRIP compares reinvesting every dividend against taking the dividends as cash, adds monthly contributions, dividend growth and share price growth, and shows the result year by year with a chart.
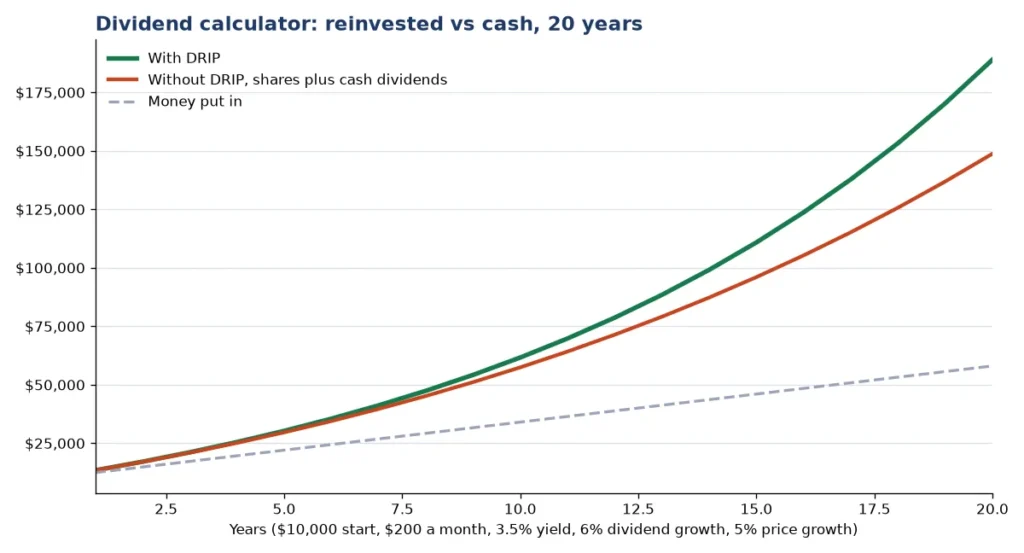
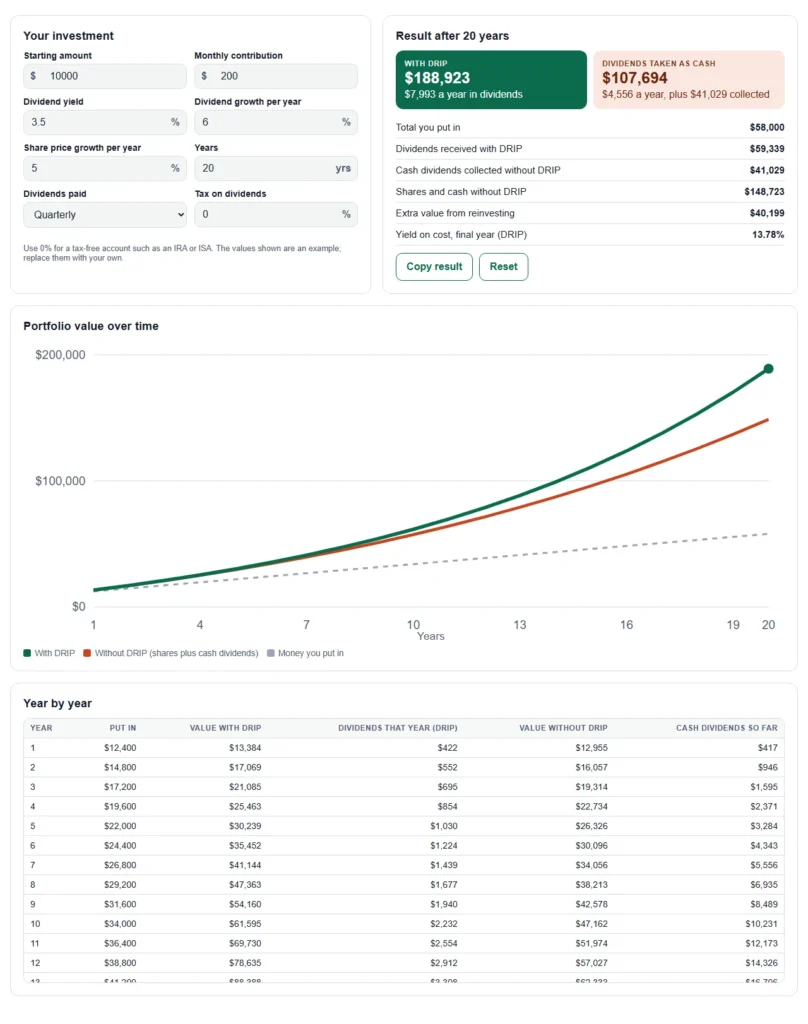
Quick answer: A dividend reinvestment plan (DRIP) uses each dividend to buy more shares, so the next dividend is paid on more shares. With $10,000 to start, $200 a month, a 3.5% yield, 6% dividend growth and 5% price growth, 20 years of reinvesting gives about $188,923, against $107,694 plus $41,029 of cash dividends without DRIP.
How to use the dividend calculator
- Type your starting amount and how much you will add each month.
- Enter the dividend yield, the yearly dividend growth and the yearly share price growth you expect.
- Choose how many years to look ahead and how often dividends are paid: monthly, quarterly, twice a year or yearly.
- Add a tax rate on dividends if the account is taxable, or leave it at 0% for an IRA, Roth IRA, TFSA or ISA.
- Read the value with DRIP and without DRIP, the dividends collected, the yield on cost, the chart and the year-by-year table.
| Box | What it means | Example |
|---|---|---|
| Dividend yield | Yearly dividends as a share of the price you pay | 3.5% means $3.50 a year per $100 invested |
| Dividend growth | How fast the dividend per share rises each year | 6% means $1.00 becomes $1.06 next year |
| Share price growth | How fast the share price rises each year | 5% a year |
| Tax on dividends | The share of each dividend you lose to tax | 15% is common on US qualified dividends |
What is a DRIP calculator?
A DRIP calculator models a dividend reinvestment plan. Instead of paying the dividend out as cash, the plan uses it to buy more shares, often fractional shares, at no extra cost. Those new shares earn dividends of their own, so the number of shares grows even when you add no new money. Most brokers let you switch DRIP on for each holding.
This dividend reinvestment calculator runs the same investment twice: once with every dividend reinvested and once with the dividends taken as cash and set aside. The difference between the two is the extra value that comes from compounding.
Dividend calculator with DRIP: a worked example
Start with $10,000, add $200 a month, and assume a 3.5% yield, 6% dividend growth, 5% share price growth and quarterly payments, with no tax. The dividend calculator gives:
| Year | Money put in | Value with DRIP | Yearly dividends with DRIP | Value without DRIP, plus cash |
|---|---|---|---|---|
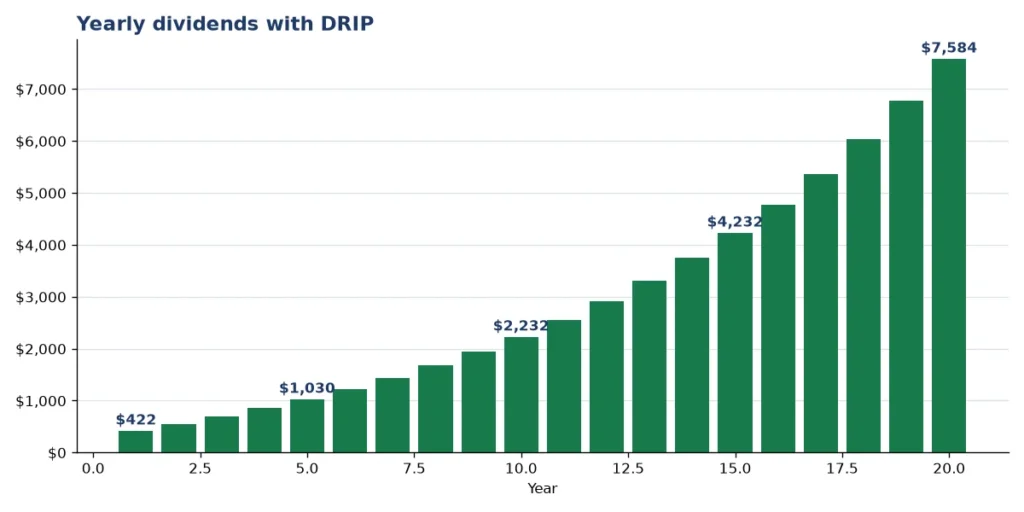
| 5 | $22,000 | $30,239 | $1,110 | $29,610 |
| 10 | $34,000 | $61,595 | $2,370 | $57,393 |
| 15 | $46,000 | $110,793 | $4,470 | $95,957 |
| 20 | $58,000 | $188,923 | $7,993 | $148,723 |
After 20 years you have put in $58,000. With DRIP the portfolio is worth about $188,923 and pays about $7,993 a year in dividends, a yield on cost of 13.8%. Without DRIP the shares are worth $107,694 and you have collected $41,029 in cash, $148,723 in total.
The gap of about $40,199 is the value of reinvesting. It is small in the first years and grows quickly later, which is why reinvested dividends matter most over long periods.
How the dividend calculator works
The calculator runs month by month. Each month the share price and the dividend per share grow by one twelfth of the yearly rate, compounded, and your monthly contribution buys shares at that month’s price. When a dividend is due, it is the number of shares times the dividend per share for the period, less any tax.
- With DRIP, the after-tax dividend buys more shares at the current price.
- Without DRIP, the after-tax dividend is added to a cash total that earns nothing.
- Yield on cost is the final year’s dividends divided by everything you put in.
The model uses steady rates, which real markets never deliver. Treat the dividend calculator result as a planning range, not a forecast, and try a lower growth rate to see a cautious case.
Dividend yield calculator: yield, yield on cost and growth
Dividend yield is the yearly dividend per share divided by the share price. A share priced at $50 that pays $2 a year has a 4% yield. As a dividend yield calculator, the formula is simply the yearly dividend divided by the price, times 100.
Yield on cost is the yearly dividend divided by what you paid. It rises over time when the dividend grows, even if the current yield stays the same. In the example above, yield on cost reaches about 13.8% after 20 years.
Dividend growth is how fast a company raises its dividend. A dividend growth calculator shows that a lower yield with fast growth can overtake a higher yield with slow growth, given enough years.
| Starting $10,000 with DRIP, 4% price growth | Dividends year 1 | Year 10 | Year 20 | Value after 20 years |
|---|---|---|---|---|
| 2.0% yield, 10% growth | $225 | $679 | $2,819 | $45,908 |
| 3.5% yield, 6% growth | $384 | $921 | $2,625 | $51,237 |
| 5.0% yield, 2% growth | $536 | $957 | $1,691 | $49,868 |
Dividend income calculator: how much do you need?
To work backward from an income goal, divide the yearly income you want by the yield. At a 4% yield, $20,000 a year of dividends needs a portfolio of $500,000; at 3%, it needs about $666,667. Use the dividend income calculator above with different monthly contributions to see how many years it takes to reach that size.
| Yearly dividend income | At 3% yield | At 4% yield | At 5% yield |
|---|---|---|---|
| $5,000 | $166,667 | $125,000 | $100,000 |
| $10,000 | $333,333 | $250,000 | $200,000 |
| $20,000 | $666,667 | $500,000 | $400,000 |
| $40,000 | $1,333,333 | $1,000,000 | $800,000 |
Higher yields can come with more risk, such as a dividend that is cut when profits fall. A very high yield is sometimes a sign the market expects a cut.
Inflation matters too. If prices rise about 3% a year, $20,000 of income today needs about $36,000 in 20 years to buy the same things. Dividends that grow faster than inflation keep their buying power; dividends that never rise lose it. Set the dividend growth box to at least your expected inflation rate to see whether your plan keeps up, and remember that a portfolio built for income still needs some growth over a long retirement.
n
Taxes on dividends
In a taxable account, tax reduces each dividend before it can be reinvested, which slows the compounding. Type your tax rate in the dividend calculator to see the effect. The rules differ by country:
- United States. Qualified dividends are taxed at 0%, 15% or 20%. For 2026 the 0% rate applies to taxable income up to $49,450 single or $98,900 joint, and the 15% rate up to $545,500 single or $613,700 joint. Ordinary dividends are taxed as regular income.
- United Kingdom. The first £500 of dividends each year is tax free. Above that, the rates from 6 April 2026 are 10.75% for basic rate, 35.75% for higher rate and 39.35% for additional rate taxpayers. Dividends inside an ISA are tax free.
- Canada. Eligible dividends from Canadian companies get a dividend tax credit that lowers the tax, and dividends in a TFSA are tax free.
- Australia. Franking credits can offset tax already paid by the company, so the effective rate depends on your own tax rate.
Check the rules for your own situation; this dividend calculator applies one flat rate you choose.
Dividend dates explained
Four dates decide who gets a dividend and when. Knowing them helps you read a company’s announcement and know whether a purchase will earn the next payment.
| Date | What happens |
|---|---|
| Declaration date | The company announces the amount and the dates. |
| Ex-dividend date | You must own the shares before this day to receive the payment. Buy on or after it and the seller gets the dividend. |
| Record date | The company checks its list of shareholders. In the US it is usually the same business day as the ex-dividend date. |
| Payment date | The money is paid, or reinvested if you use a DRIP. |
The share price usually drops by roughly the dividend amount on the ex-dividend date, because the payment is leaving the company. That is why buying just before a dividend does not create free money.
Dividend stocks or dividend funds?
Individual dividend stocks let you choose each company and its payout, but one cut can hit your income hard. Dividend funds and ETFs hold dozens or hundreds of companies, so a single cut matters less, and many funds offer reinvestment through your broker.
Funds charge a yearly expense ratio, which comes out of returns before you see them. A fund with a 0.10% expense ratio costs $10 a year on $10,000. When you compare funds, look at the yield, how much the dividend has grown over the last ten years, and the cost.
How safe is a dividend?
The payout ratio is the share of profits a company pays out as dividends. A company that earns $4 a share and pays $2 has a 50% payout ratio. A low or moderate ratio leaves room to keep paying if profits fall; a ratio near or above 100% means the dividend may not be sustainable.
- A long record of raising the dividend each year is a good sign, though not a guarantee.
- Steady cash flow matters more than one strong year of profits.
- High debt can force a company to cut its dividend in a downturn.
- A yield far above similar companies often means the market expects trouble.
Living on dividends in retirement
Some retirees plan to spend only the dividends and leave the shares untouched. The appeal is that income keeps coming while the portfolio stays invested. The drawback is that it needs a large portfolio: at a 3% yield, every $1,000 a month of income needs $400,000 invested.
A common approach is to reinvest dividends while working, then switch DRIP off at retirement and take the dividends as cash. Run the numbers for your own plan with the retirement calculator, and keep enough cash for emergencies so you never have to sell shares at a low price.
DRIP pros and cons
| Reinvesting (DRIP) | Taking dividends as cash |
|---|---|
| Compounds automatically, with no decisions to make | Gives income you can spend now |
| Buys fractional shares with every payment | Lets you invest the cash elsewhere |
| Builds a larger holding in the same company or fund | Avoids adding more to a holding that is already large |
| In a taxable account, tax is still due on reinvested dividends | Same tax, but you keep the cash to pay it |
Many investors reinvest while they are building a portfolio and switch to cash dividends when they need the income, such as in retirement.
Dividend calculator scenarios to try
The dividend calculator is most useful when you compare a few cases side by side. Change one box at a time and watch the value with DRIP, the yearly dividends and the gap between reinvesting and taking cash.
- A cautious case. Cut dividend growth to 3% and price growth to 3%. This shows what happens if the next 20 years are weaker than the last 20.
- A taxable account. Set tax on dividends to 15%. Each reinvested dividend shrinks, so the gap between DRIP and cash narrows, and the value after 20 years falls.
- A late start. Set years to 10 instead of 20. The value with DRIP falls by much more than half, because compounding does most of its work in the later years.
- Bigger contributions. Raise the monthly amount from $200 to $500. Contributions drive most of the result in the early years.
- Monthly payers. Switch from quarterly to monthly payments. The difference is small, because the yearly dividend is the same and only the timing changes.
Write down the value and yearly dividends for each case. The range between the cautious case and your main case is a more honest picture than any single dividend calculator result.
When you look at a specific stock or fund, use its current yield and a dividend growth rate close to its recent history, then run a lower growth rate as well. The dividend calculator does not fetch live prices, so check the yield on the day you plan to buy.
Mistakes to avoid with dividend calculators
- Using a high current yield with a high growth rate. Fast dividend growth usually comes with a lower yield.
- Forgetting tax in a taxable account, which can cut each reinvested dividend by 15% or more.
- Treating the result as a promise. Dividends can be cut and prices can fall.
- Comparing DRIP with cash without counting the cash dividends you collected.
Frequently asked questions
10 quick answers
How do I calculate dividend income?
Multiply the number of shares by the yearly dividend per share. For a portfolio, multiply its value by the dividend yield: $100,000 at a 4% yield pays $4,000 a year.
What does DRIP mean?
DRIP stands for dividend reinvestment plan. Each dividend buys more shares of the same stock or fund instead of being paid out as cash.
Is it better to reinvest dividends?
Over long periods reinvesting usually leaves you with a larger portfolio, because dividends earn dividends. If you need income now, taking cash can make more sense.
Are reinvested dividends taxed?
In a taxable account, yes. Reinvested dividends are taxed in the year they are paid, the same as cash dividends. In tax-free accounts they are not.
What is a good dividend yield?
Many broad dividend funds yield around 2% to 4%. Much higher yields can signal higher risk of a dividend cut.
What is yield on cost?
Yield on cost is the yearly dividend divided by what you paid for the shares. It rises as the dividend grows.
How often are dividends paid?
Most US companies pay quarterly. Some funds and companies pay monthly, and many UK and European companies pay twice a year or yearly.
Can I use this as a DRIP calculator for a specific stock?
Yes. Enter that stock’s current yield and the dividend growth you expect. The calculator does not look up live prices.
Does the dividend calculator include monthly contributions?
Yes. Each monthly contribution buys shares at that month’s price, and those shares earn dividends from then on.
Is this dividend calculator free?
Yes. It is free, runs in your browser and does not store what you type. It is an estimate, not investment advice.
Related calculators
- Compound interest calculator
- Retirement calculator
- All financial calculators
- Self-employment tax calculator
Sources and further reading
- IRS Topic 404: Dividends for qualified and ordinary dividends
- IRS Revenue Procedure 2025-32 for the 2026 capital gains rate thresholds
- GOV.UK: Tax on dividends for the £500 allowance and 2026 to 2027 rates
- Investor.gov: Dividend reinvestment plans
This dividend calculator is for education and planning, not investment advice. Past dividends and growth do not guarantee future results.
Last updated: October 2026.