A mean median mode calculator finds the average (mean), the middle value (median), the most common value (mode) and the range of any list of numbers. Paste your numbers into the calculator above and it sorts them, shows each answer with the working, and adds the sum, count, midrange and standard deviation.
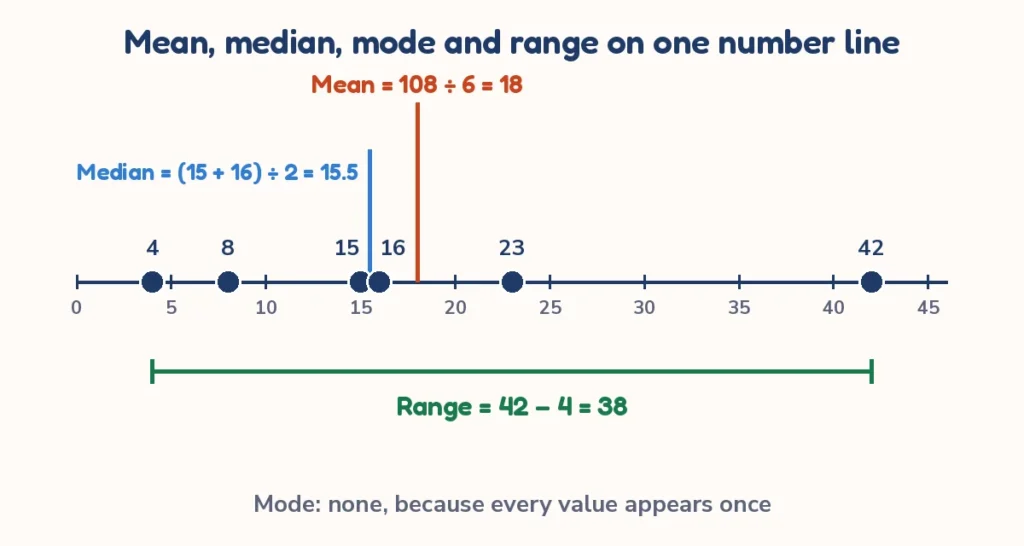
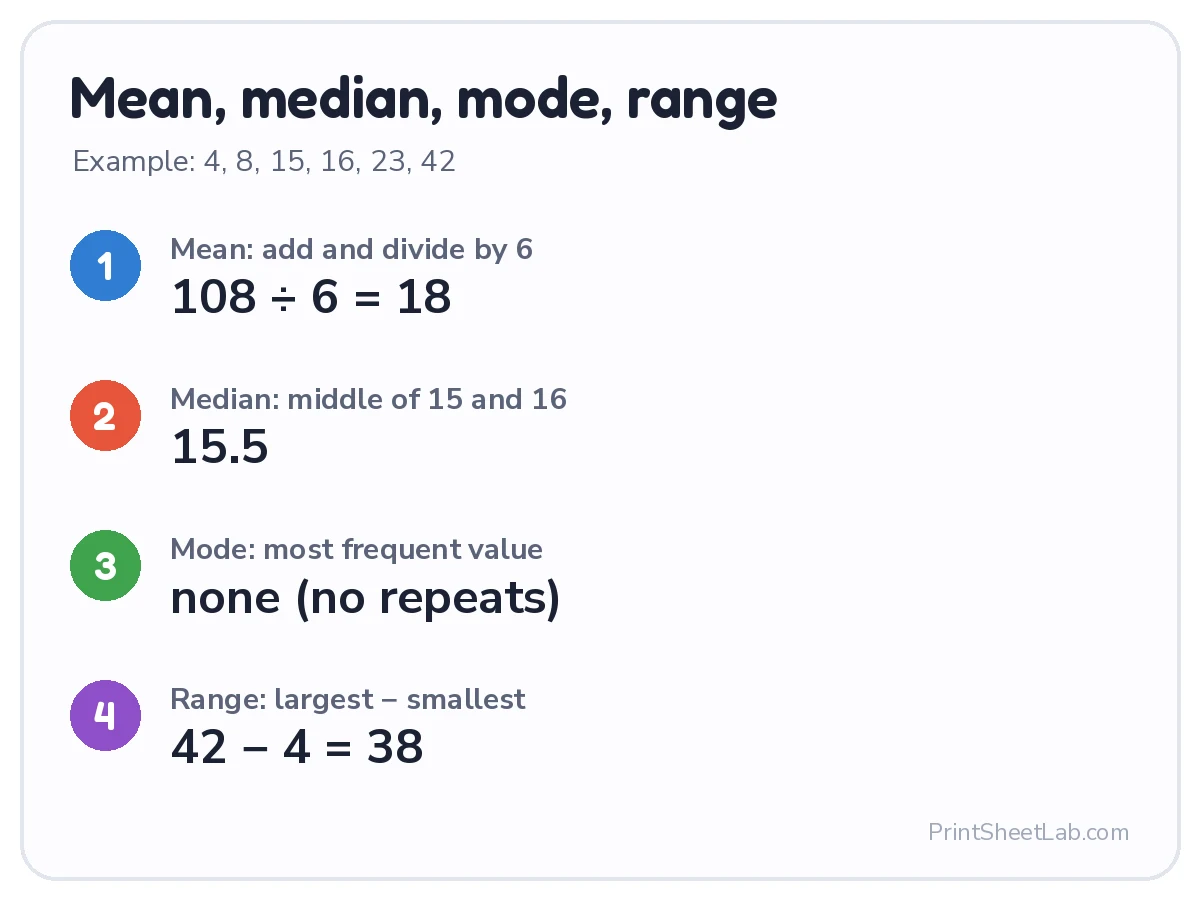
Quick answer: the mean is the sum divided by the count, the median is the middle value of the sorted list, the mode is the value that appears most often, and the range is the largest value minus the smallest. For 4, 8, 15, 16, 23 and 42, the mean is 18, the median is 15.5, there is no mode and the range is 38.
How to use the mean median mode calculator
The mean median mode calculator needs one thing from you: a list of numbers. The answers update as you type, so there is no Calculate button to press.
- Type or paste your numbers, separated by commas, spaces or new lines. You can paste a column from a spreadsheet.
- Choose how many decimal places you want: whole numbers, or 1 to 4 decimal places.
- Read the big answer (the mean), then the tiles below it for the median, mode, range, count, sum and more.
- Open the step-by-step list to see the sorted numbers and the working, then use Copy result to paste the answers.
| Input or output | What it means |
|---|---|
| Numbers | Your data set. Decimals and negatives work. Type 1000, not 1,000, because a comma separates values. |
| Round answers to | Whole number or 1 to 4 decimal places. Only the display is rounded. |
| Sum, count, midrange, standard deviation | Extra facts for checking. See the standard deviation calculator. |
Mean median mode formula: how each one is calculated
Each of the four statistics has a short rule. Let the numbers be x1, x2 and so on up to xn, where n is how many numbers there are.
- Mean = (x1 + x2 + … + xn) ÷ n. Add everything, then divide by the count.
- Median = the middle value after sorting. If n is odd it is number (n + 1) ÷ 2 in the sorted list. If n is even it is the average of numbers n ÷ 2 and n ÷ 2 + 1.
- Mode = the value with the highest frequency. Two or more values can tie, and a list with all different values has no mode.
- Range = largest value − smallest value.
The NIST Engineering Statistics Handbook defines the mean as the value most commonly referred to as the average, and defines the median as the point with half the data smaller and half larger.
Worked example 1: six numbers with no mode
Use the default list in the mean median mode calculator: 4, 8, 15, 16, 23, 42. The sum is 4 + 8 + 15 + 16 + 23 + 42 = 108, and there are 6 numbers, so the mean is 108 ÷ 6 = 18. With an even count the median is the average of the 3rd and 4th values: (15 + 16) ÷ 2 = 15.5. Every value appears once, so there is no mode. The range is 42 − 4 = 38.
Worked example 2: a list with a mode
Try 12, 4, 9, 4, 6. Sorted, the list is 4, 4, 6, 9, 12. The sum is 35 and there are 5 numbers, so the mean is 35 ÷ 5 = 7. With an odd count the median is the 3rd value, which is 6. The value 4 appears twice and every other value once, so the mode is 4. The range is 12 − 4 = 8.
Mean median mode examples and a printable cheat sheet
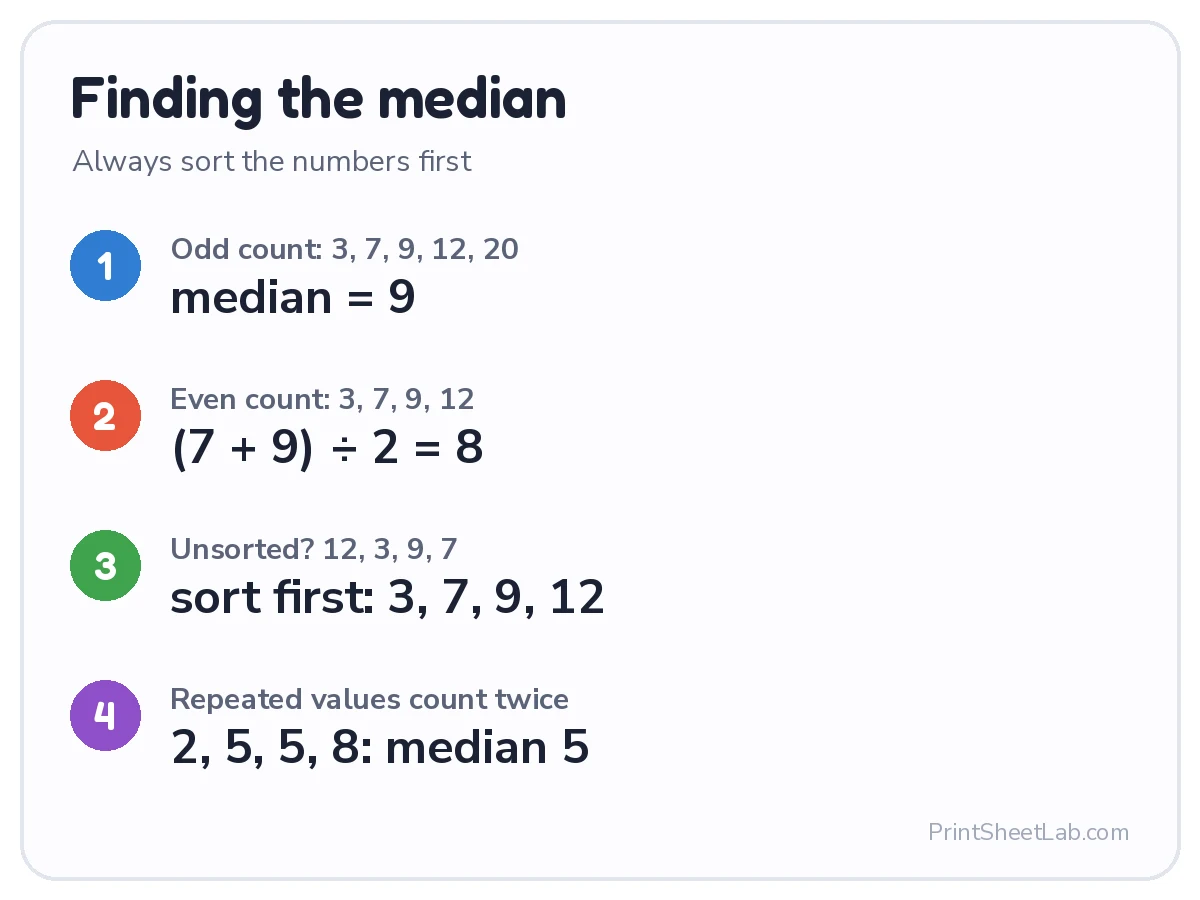
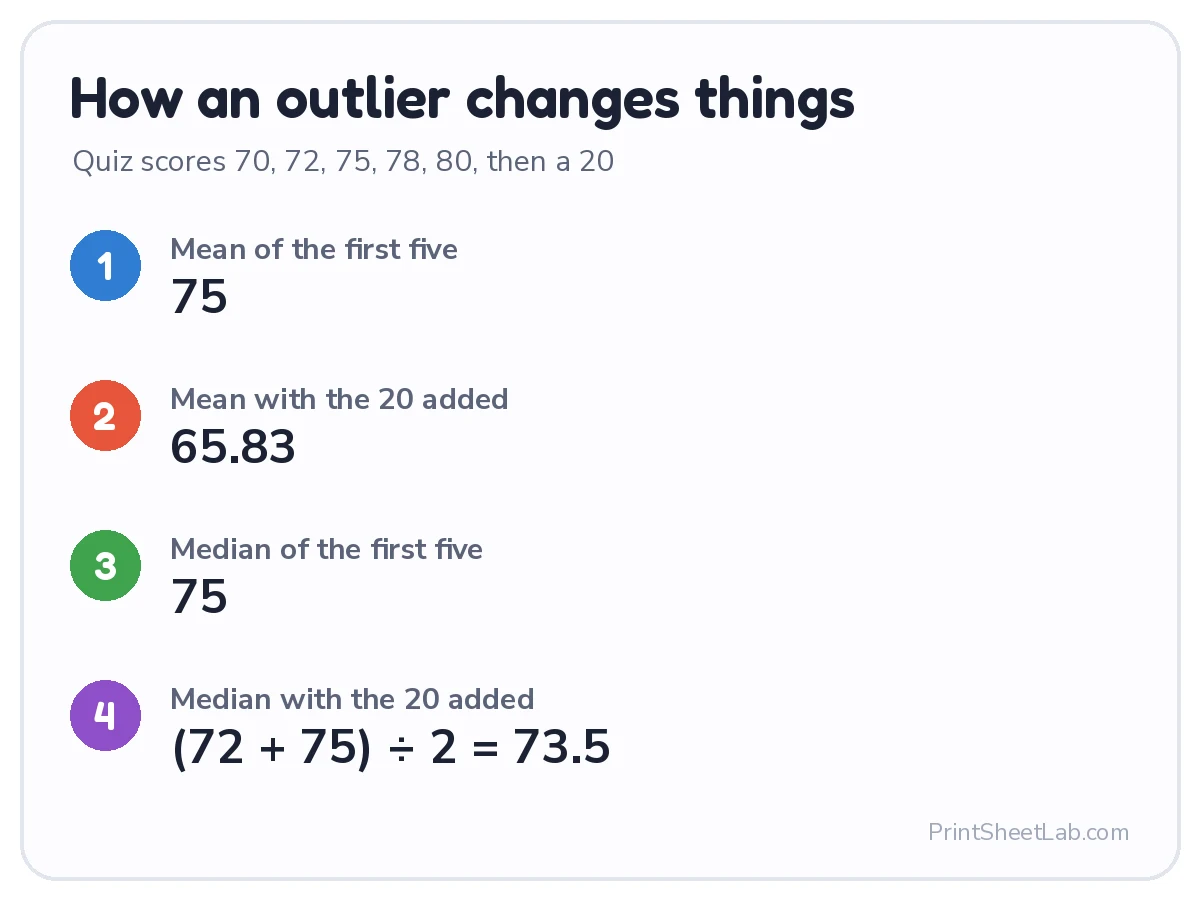
The cards below work through a full example, show how to find the median for an odd and an even count, and show how one unusual value changes the mean but barely moves the median. The printable cheat sheet has the four definitions, a memory rhyme and four practice sets with answers.

Mean median mode range calculator: results for common data sets
This table uses the same formulas as the mean median mode calculator, so you can check your own work against it.
| Data set | Numbers | Mean | Median | Mode | Range |
|---|---|---|---|---|---|
| Quiz scores | 70, 72, 75, 78, 80 | 75 | 75 | none | 10 |
| Daily high temperatures (°F) | 68, 71, 71, 74, 75, 77, 82 | 74 | 74 | 71 | 14 |
| Temperatures with negatives (°C) | −4, −2, 0, 3, 3 | 0 | 0 | 3 | 7 |
Average calculator: how to find the mean
To find the mean, add all the numbers and divide by how many there are, as in the worked example above: 108 ÷ 6 = 18. The mean is what most people call the average, and it uses every value in the set.
The mean can be a decimal even when every value is a whole number: the mean of 1, 2 and 4 is 7 ÷ 3 = 2.33 (rounded). Use the rounding setting in the mean median mode calculator to show as many decimals as you need.
How to find the median
The median is the middle value once the numbers are in order. With an odd count it is the single middle number: in 3, 7, 9, 12, 20 the median is 9. With an even count it is halfway between the two middle numbers: in 3, 7, 9, 12 the median is (7 + 9) ÷ 2 = 8. In the six-number example, the two middle values are 15 and 16, so the median is 15.5.
Always sort first. The biggest median mistake is picking the middle of an unsorted list. Repeated values each count separately, so 2, 5, 5, 8 has a median of 5. Wikipedia’s median article explains why it suits incomes and house prices.
Mode and the range calculator
The mode is the value that appears most often. A set can have one mode (2, 3, 3, 5 has mode 3), more than one (1, 2, 2, 3, 3 has modes 2 and 3) or none at all when every value appears once, as in 4, 8, 15, 16, 23, 42. The mean median mode calculator lists every mode, or says there is none. Wikipedia’s mode article covers sets with several modes.
The range measures spread: the largest value minus the smallest. For the example set, 42 − 4 = 38. A small range means the values are close together; a large range means they are spread out. Use the range from the mean median mode calculator alongside the mean to describe a data set, and add the standard deviation for a finer measure of spread.
Mean vs median: when one is better
An outlier, a value far from the rest, pulls the mean but barely moves the median. Quiz scores of 70, 72, 75, 78 and 80 have a mean and median of 75. Add one score of 20, and the mean drops to 65.83 while the median only moves to 73.5. When a set has outliers, the median usually describes a typical value better; when values are evenly spread, the mean is the more common choice.
Mean median mode with outliers: what happens to each
In the mean median mode calculator, this table starts from the five quiz scores above (mean 75, median 75) and adds one extra score. The mean moves a lot with an extreme value and the median moves a little.
| Extra score added | New mean | New median | Mean change | Median change |
|---|---|---|---|---|
| 20 | 65.83 | 73.5 | -9.17 | -1.5 |
| 60 | 72.5 | 73.5 | -2.5 | -1.5 |
| 100 | 79.17 | 76.5 | 4.17 | 1.5 |
| 500 | 145.83 | 76.5 | 70.83 | 1.5 |
A salary example: why news stories quote the median
Imagine seven employees earn (in thousands of dollars) 38, 42, 45, 47, 52, 58, 310. The mean is 84.57, which is higher than six of the seven salaries, because one very large salary pulls it up. The median is 47, the salary of the person in the middle, so it describes a typical employee better. Paste the seven salaries into the mean median mode calculator to see both.
Mean median mode for a skewed distribution
The three averages also hint at the shape of the data. The order below is a rule of thumb for single-peaked data, and Wikipedia’s skewness article explains the exceptions. The mean median mode calculator shows all three values side by side.
| Shape of the data | Typical order | Example |
|---|---|---|
| Symmetric, one peak | mean = median = mode | 2, 3, 3, 3, 4: all three equal 3 |
| Right-skewed (long tail of large values) | mean > median > mode | incomes and house prices |
| Left-skewed (long tail of small values) | mean < median < mode | test scores bunched near the top with a few very low scores |
Mean median mode from a frequency table
When values repeat many times, data is often given as a frequency table. To find the mean, multiply each value by its frequency, add the results and divide by the total frequency. The mode is the value with the highest frequency, and the median comes from the running totals. Here are 30 shoe sizes from a survey.
| Shoe size (x) | Frequency (f) | x × f | Running total of f |
|---|---|---|---|
| 5 | 3 | 15 | 3 |
| 6 | 5 | 30 | 8 |
| 7 | 9 | 63 | 17 |
| 8 | 7 | 56 | 24 |
| 9 | 4 | 36 | 28 |
| 10 | 2 | 20 | 30 |
The total frequency is 30 and the sum of x × f is 220, so the mean is 220 ÷ 30 = 7.33. The 15th and 16th values both fall in size 7, so the median is 7. The highest frequency is 9, so the mode is size 7. Type all 30 sizes into the mean median mode calculator to check.
Mean median mode grouped data: a worked example
For grouped data the answers are estimates. Use the class midpoint for the mean. In the median and mode formulas, l is the lower boundary of the class, h is the class width, f is its frequency and cf is the cumulative frequency before it.
| Class | Frequency (f) | Midpoint (x) | f × x | Cumulative f |
|---|---|---|---|---|
| 0 to 10 | 5 | 5 | 25 | 5 |
| 10 to 20 | 8 | 15 | 120 | 13 |
| 20 to 30 | 15 | 25 | 375 | 28 |
| 30 to 40 | 16 | 35 | 560 | 44 |
| 40 to 50 | 6 | 45 | 270 | 50 |
With N = 50, the mean is 1,350 ÷ 50 = 27. Half of N is 25, so the median class is 20 to 30 and the median is l + (N ÷ 2 − cf) ÷ f × h = 20 + (25 − 13) ÷ 15 × 10 = 28.
The modal class is 30 to 40, so the mode is l + (f1 − f0) ÷ (2f1 − f0 − f2) × h = 30 + (16 − 15) ÷ (32 − 15 − 6) × 10 = 30.91 (rounded to 2 places).
Mean median mode in Excel, Google Sheets and a TI-84
You can check any answer from the mean median mode calculator in a spreadsheet. Use the mean median mode calculator to confirm a formula. Microsoft documents the AVERAGE function, the MEDIAN function and the MODE.SNGL function. On a TI-84, put the numbers in a list and choose STAT, CALC, 1-Var Stats: it shows the mean and median but not the mode.
- In a spreadsheet: =AVERAGE(A1:A10), =MEDIAN(A1:A10), =MODE.SNGL(A1:A10) (=MODE in Google Sheets; =MODE.MULT lists every mode), =MAX(A1:A10)-MIN(A1:A10) for the range and =STDEV.S(A1:A10) for a sample standard deviation.
Mean median mode range practice
Try these, then check them with the mean median mode calculator (answers in brackets):
- 3, 5, 5, 7, 10 (mean 6, median 5, mode 5, range 7)
- 12, 4, 9, 4, 6 (mean 7, median 6, mode 4, range 8)
- 1, 2, 2, 3, 3, 9 (mean 3.33, median 2.5, mode 2 and 3, range 8)
For graphs that go with these statistics, print the free graphing worksheets or the math word problems worksheets, and use the percentage calculator for percent scores.
Mean median mode calculator for real data
Record the high temperature every day for a week, the pages read each night or the scores from a class quiz, then paste the list into the mean median mode calculator. For high temperatures of 68, 71, 71, 74, 75, 77 and 82 °F, the mean is 74, the median is 74, the mode is 71 and the range is 14.
Everyday uses and common mistakes
- Not sorting first: the middle of an unsorted list is not the median.
- Averaging averages: the mean of two group means is correct only when both groups are the same size. Use a weighted average otherwise.
- Typing 1,000: a comma separates values in the mean median mode calculator, so type 1000.
Names and grade levels around the world
In the United States the topic is usually taught in middle school. In the UK, Australia and New Zealand it is called averages, and the mean is often just called the average. In India, class 10 covers the mean, median and mode of grouped data, as in the worked example above.
Mean median mode calculator: frequently asked questions
How do I find the mean, median, mode and range?
Sort the numbers. The mean is the sum divided by the count, the median is the middle value (or the average of the two middle values), the mode is the most frequent value and the range is the largest minus the smallest. Paste your list into the mean median mode calculator for all four at once.
What is the difference between mean, median and mode?
The mean is the arithmetic average, the median is the middle value and the mode is the most common value. They can all give different answers for the same data.
Can a data set have more than one mode, or no mode?
Yes. If two or more values tie for the highest count, each is a mode (1, 2, 2, 3, 3 has modes 2 and 3). If every value appears once, there is no mode, as in 4, 8, 15, 16, 23, 42.
Which is better, the mean or the median?
Use the mean for balanced data and the median when there are outliers or the data are skewed, as with incomes and house prices.
Can I enter decimals or negative numbers?
Yes. Separate them with commas or spaces, such as -2.5, 3, 4.75. The calculator sorts them first, so the order does not matter.
How do I find the mean from a frequency table?
Multiply each value by its frequency, add the results and divide by the total frequency. The frequency table above shows the full method with 30 shoe sizes.
Related calculators
- Standard deviation calculator: how spread out the numbers are
- Grade calculator and GPA calculator: averages for school (the mean median mode calculator covers plain averages)
- Weighted grade calculator: when the numbers count for different amounts
- Rounding calculator and significant figures calculator: round averages correctly
- All calculators
Sources and further reading
- NIST/SEMATECH e-Handbook of Statistical Methods: Measures of location (mean and median definitions)
- Wikipedia: Median
- Wikipedia: Mode (statistics)
Last updated: October 2026.