Polar graph paper has circles around a center point and straight lines at equal angles, so you can plot a point by its distance and its angle. These free printable polar graph paper sheets have 5, 10, 15 or 30 degree lines, 5 to 20 circles, and degree or radian labels, with one, two or four graphs per page.
Polar graph paper to print (PDF)
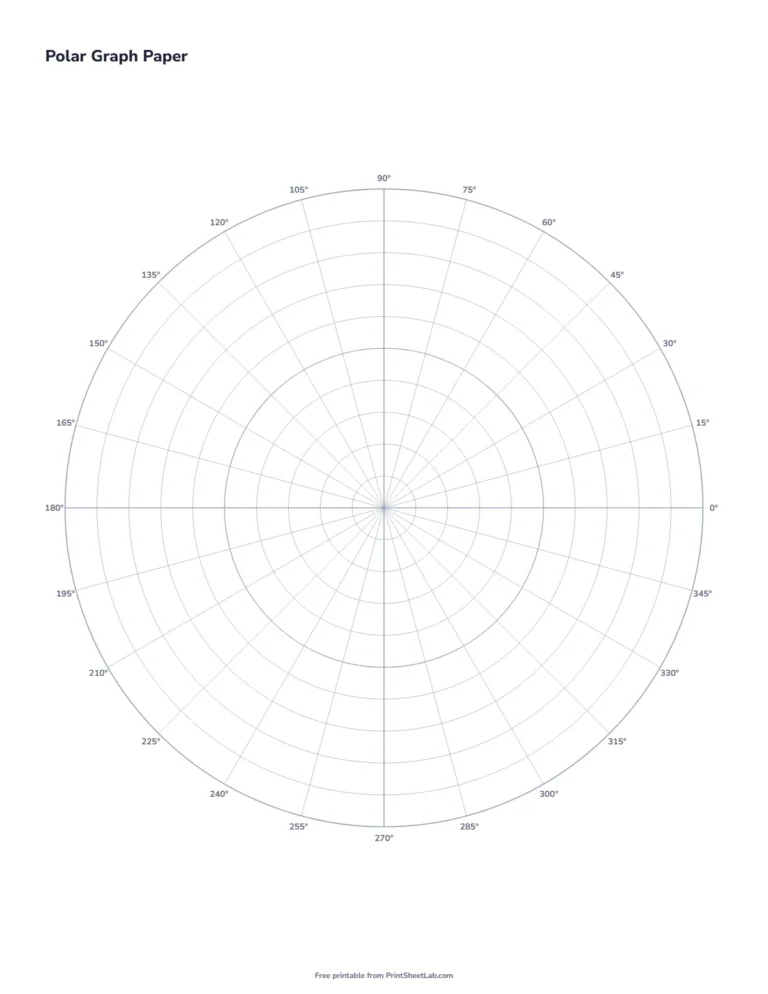
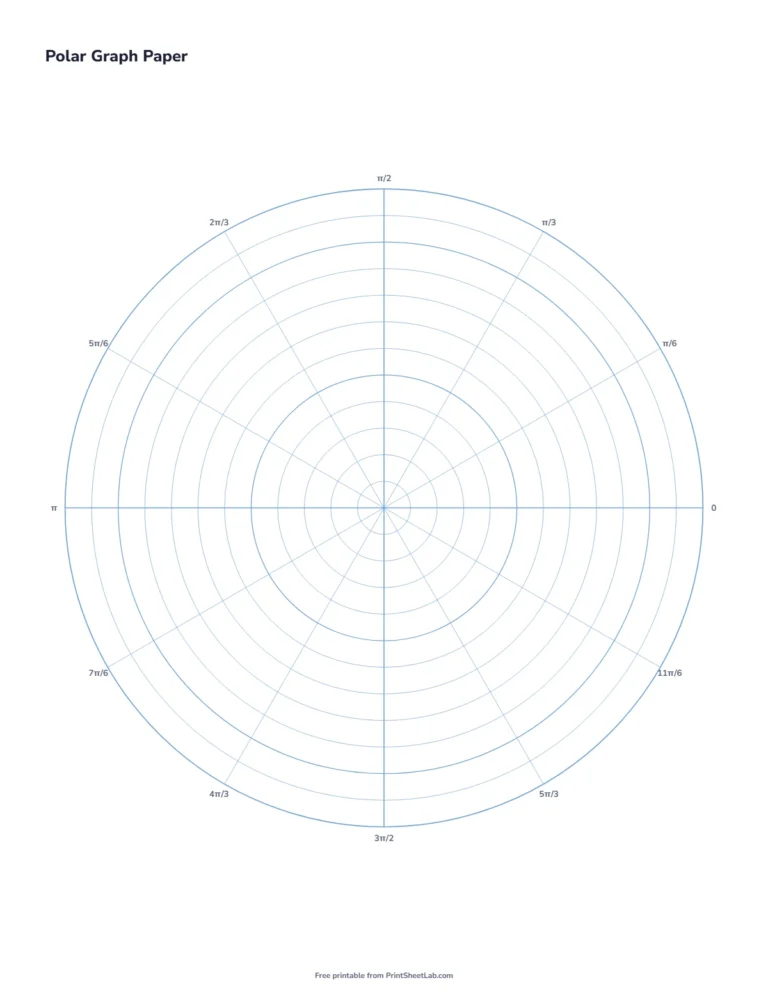
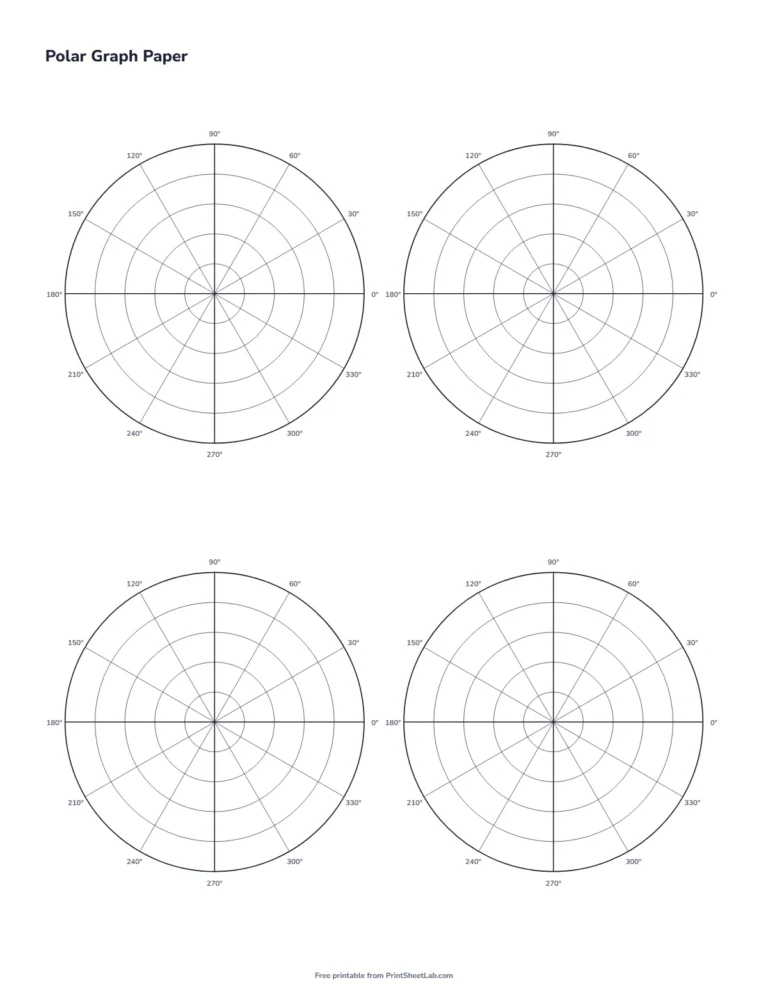
These four pages show the choices: a 15 degree sheet with 10 circles, a radians sheet with 12 circles, four small graphs on one page, and a cardioid plotted as an example. Click a picture for the PDF, or use the generator above to choose the angle lines, the number of circles and the labels.
How polar coordinate paper works
On ordinary graph paper you find a point by going across and then up. On polar coordinate paper you give two numbers instead. The first is r, the distance from the center (called the pole). The second is θ, the angle, measured counterclockwise from the line that runs to the right, which is 0°. The point (8, 45°) is eight circles out along the 45° line. For a short history and the formulas, see Wikipedia’s polar coordinate system article.
Polar grid printable: angle lines and circles
This polar grid printable lets you choose how often the angle lines appear. A sheet with lines every 15° has 24 spokes from the center, one at every multiple of 15°. The lines at 0°, 90°, 180° and 270° are a little bolder than the others.
| Lines every | Lines on the sheet | Angle labels | Good for |
|---|---|---|---|
| 5° | 72 | Every 5° | Careful plots, navigation and surveying practice |
| 10° | 36 | Every 10° | Detailed plots and trigonometry |
| 15° | 24 | Every 15° | The usual choice for precalculus |
| 30° | 12 | Every 30° (π/6) | Four graphs on one page, quick sketches |
The generator also offers 5, 10, 12 or 20 circles. The outer circle is drawn slightly heavier, and every fifth circle is darker so that you can count quickly.
How far apart are the circles?
One graph per page uses a circle with a radius of 3.53 inches. When you print two or four graphs on a page, each circle is smaller, with a radius of 1.65 inches. This table shows the gap between two circles, which is the size of one unit if you let each circle count as one:
| Circles | Gap between circles, 1 graph per page | Gap between circles, 2 or 4 graphs per page |
|---|---|---|
| 5 | 0.706 in | 0.331 in |
| 10 | 0.353 in | 0.166 in |
| 12 | 0.294 in | 0.138 in |
| 20 | 0.176 in | 0.083 in |
For a graph you will read closely, use one graph per page with 10 circles. For quick practice sets, choose four graphs and 5 circles.
Radians polar graph: degrees and radians on polar graph paper
For a radians polar graph, choose “Radians” and the labels around the edge change from degrees to multiples of π, such as π/6 and π/2. Radians are the angle unit used in calculus. One full turn is 2π radians, which is 360°. This table lists every 15° from 0° to 180°:
| Degrees | Radians (exact) | Radians (decimal) |
|---|---|---|
| 0° | 0 | 0.000 |
| 15° | π/12 | 0.262 |
| 30° | π/6 | 0.524 |
| 45° | π/4 | 0.785 |
| 60° | π/3 | 1.047 |
| 75° | 5π/12 | 1.309 |
| 90° | π/2 | 1.571 |
| 105° | 7π/12 | 1.833 |
| 120° | 2π/3 | 2.094 |
| 135° | 3π/4 | 2.356 |
| 150° | 5π/6 | 2.618 |
| 165° | 11π/12 | 2.880 |
| 180° | π | 3.142 |
For the angles from 195° to 345°, add π to the radian value of the matching angle: 195° is 13π/12, and 345° is 23π/12.
Polar coordinates graph paper: converting to rectangular coordinates
Polar coordinates graph paper helps you check conversions. A point with polar coordinates (r, θ) has rectangular coordinates x = r cos θ and y = r sin θ. Going the other way, r = √(x² + y²) and tan θ = y/x. Three examples:
- (8, 45°) becomes x = 8 cos 45° = 5.66 and y = 8 sin 45° = 5.66. Plot it: eight circles out along the 45° line.
- (4, 120°) becomes x = 4 cos 120° = -2.00 and y = 4 sin 120° = 3.46. This point is in the upper left quadrant.
- (3, 4) in rectangular form becomes r = 5 and θ = 53.13°. Plot it at five circles out, just past 53°.
In the Common Core, students meet complex numbers in polar form in high school (standard HSN-CN.B.4), and polar curves appear in precalculus and calculus courses.
How to plot a cardioid on polar graph paper
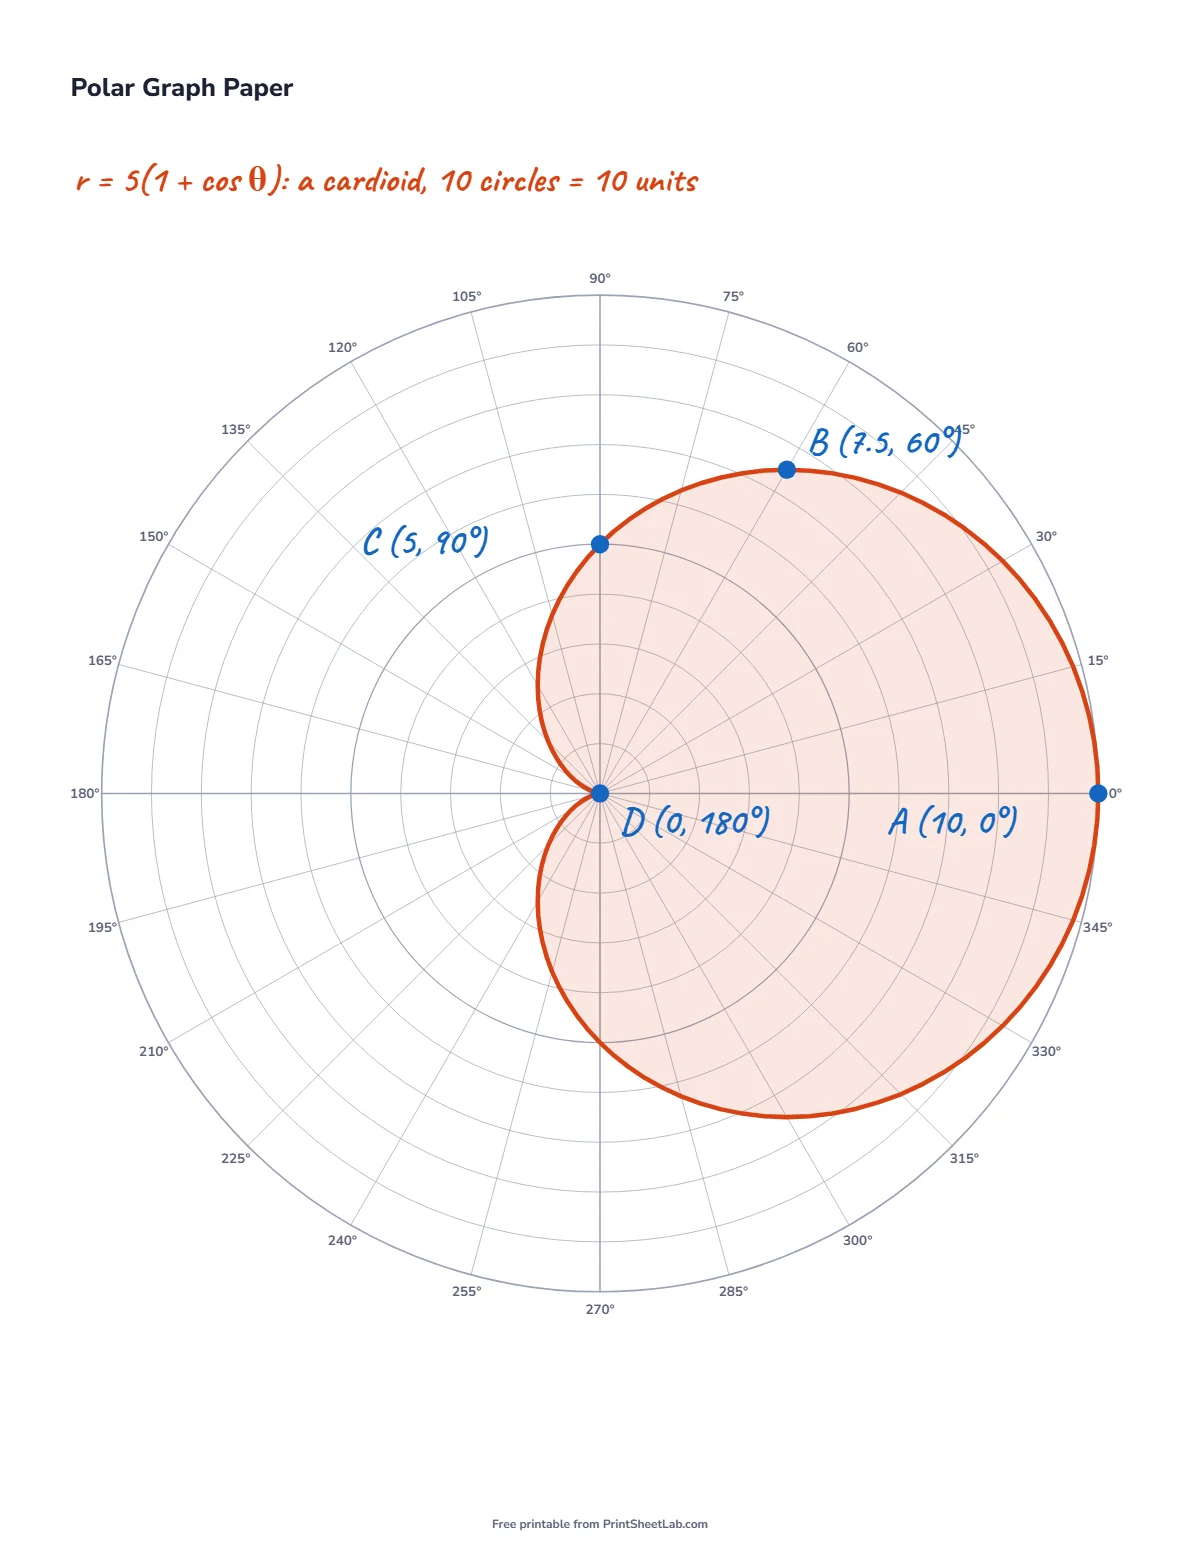
The picture above shows how to plot a cardioid, r = 5(1 + cos θ). To plot it, make a table of points and mark each one on the paper. This table gives seven of them, and the curve is symmetrical about the 0° line, so the points for 210° to 330° mirror the ones below:
| θ | cos θ | r = 5(1 + cos θ) | Point on the paper |
|---|---|---|---|
| 0° | 1.000 | 10.00 | (10.00, 0°) |
| 30° | 0.866 | 9.33 | (9.33, 30°) |
| 60° | 0.500 | 7.50 | (7.50, 60°) |
| 90° | 0.000 | 5.00 | (5.00, 90°) |
| 120° | -0.500 | 2.50 | (2.50, 120°) |
| 150° | -0.866 | 0.67 | (0.67, 150°) |
| 180° | -1.000 | 0.00 | (0.00, 180°) |
Join the points with a smooth curve. The curve reaches 10 at 0°, so the shape fits exactly in a sheet with 10 circles. At 180° the radius is zero, and the curve returns to the pole, which makes the cusp of the heart. Here are other curves worth trying:
| Equation | Shape | Notes |
|---|---|---|
| r = 4 | A circle around the pole | Constant distance from the center |
| θ = 45° | A straight line through the pole | Constant angle, any distance |
| r = 5(1 + cos θ) | Cardioid (heart shape) | The pickup pattern of a cardioid microphone |
| r = 8 cos 3θ | Rose with 3 petals | Odd n gives n petals; even n gives 2n petals |
| r = 0.5θ | Archimedean spiral | The gap between turns stays the same |
| r² = 25 cos 2θ | Lemniscate (figure eight) | Needs r on both sides of the pole |
Polar graph paper PDF: uses beyond math class
- Microphone and antenna patterns. Engineers plot sensitivity against angle on polar paper. A cardioid microphone has the same shape as the curve above.
- Navigation and radar. A compass bearing is measured clockwise from north, while a math angle is measured counterclockwise from east. Label the sheet yourself if you want a bearing grid.
- Astronomy and surveying. Positions are given as a distance and a direction from a fixed point.
- Art. Mandalas, spirograph-style patterns and rose curves are easy to draw with circles and equal angles.
Every polar graph paper PDF here is vector art, so the circles stay sharp at any size. For square grids see graph paper, and for exponential data see semi-log graph paper.
Printing tip
Print at 100% or “Actual size” and turn off “Fit to page”, so every measurement on the sheet is exact. Choose Letter or A4 paper in the generator before you download the PDF.
Polar graph paper: frequently asked questions
Can I print polar graph paper with radians?
Yes. Choose “Radians” in the generator and the labels become multiples of π, such as π/6, π/3 and π/2. Choose “None” to print a blank grid.
How many degrees apart are the lines on polar graph paper?
You can choose 5, 10, 15 or 30 degrees. With 15 degree lines, there are 24 lines on the sheet.
How many graphs can I print on one page?
You can print one, two or four graphs. Four graphs make a good practice sheet, and one graph is best for detailed plots.
How do I plot a point on polar graph paper?
Find the angle first, counting counterclockwise from the line on the right. Then count out along that line to the circle that matches r, and mark the point.
Is this polar graph paper free?
Yes. It is free to print for home and classroom use, with no sign-up.
More printable paper
- Specialty paper generator with every layout on this site
- Paper generator for lined, graph, dot grid, isometric and handwriting paper
- Graph paper, lined paper and dot grid paper