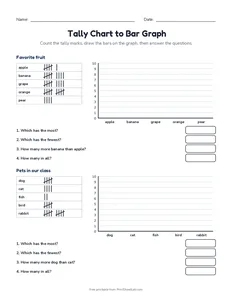
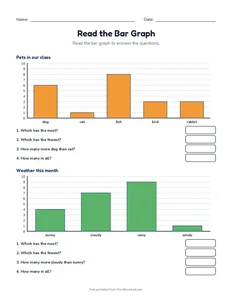
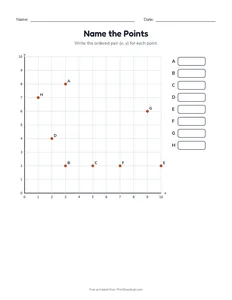
New: plot ordered pairs to reveal a coordinate plane mystery picture, or play the find-the-point game.
Graphing science data? Print a free periodic table for the lab too.
Quick answer: Graphing worksheets teach children to collect data and show it as tally charts, picture graphs, bar graphs and coordinate grids. This page has 200 free printable graphing worksheets with answer keys for grades 1 to 5. Updated October 2026.
Graphing worksheets to print (PDF)
These graphing worksheets are a sample of the 20 printable PDFs in this section, from tally charts to coordinate grids. Click a picture for the PDF, or open one of the sets below.
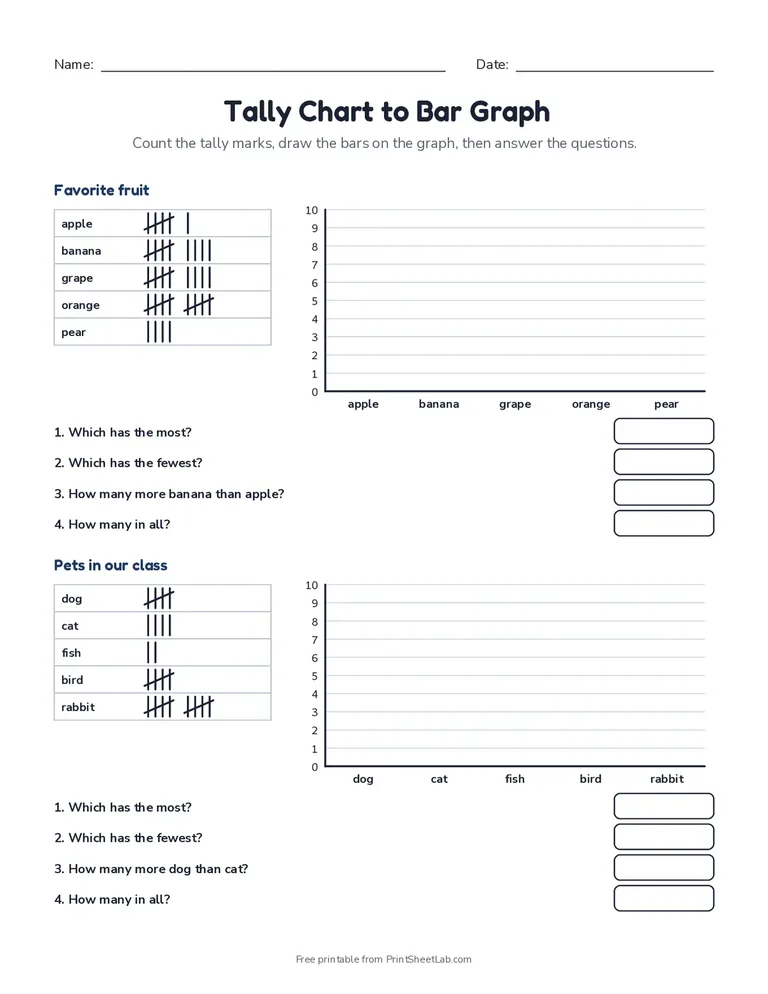
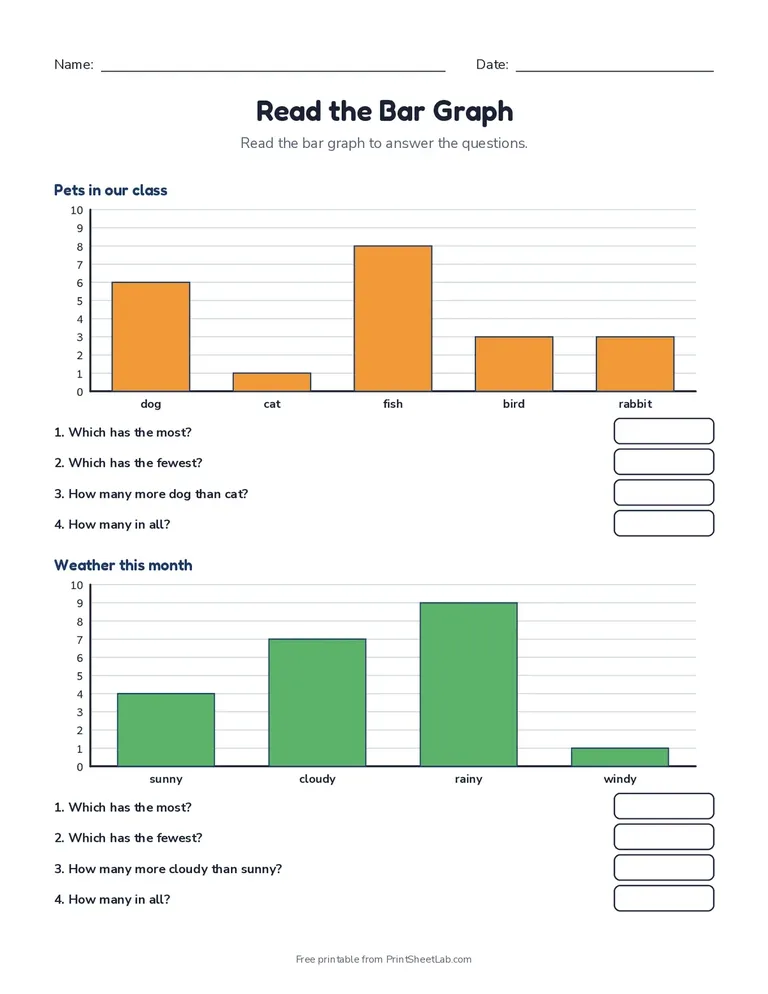
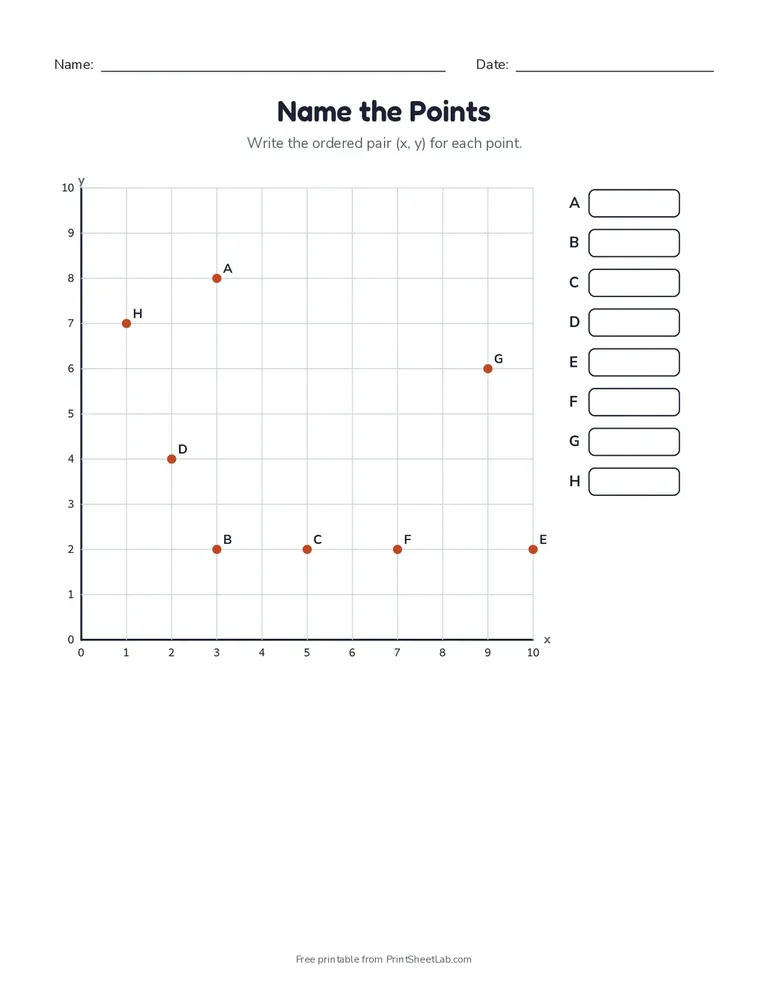
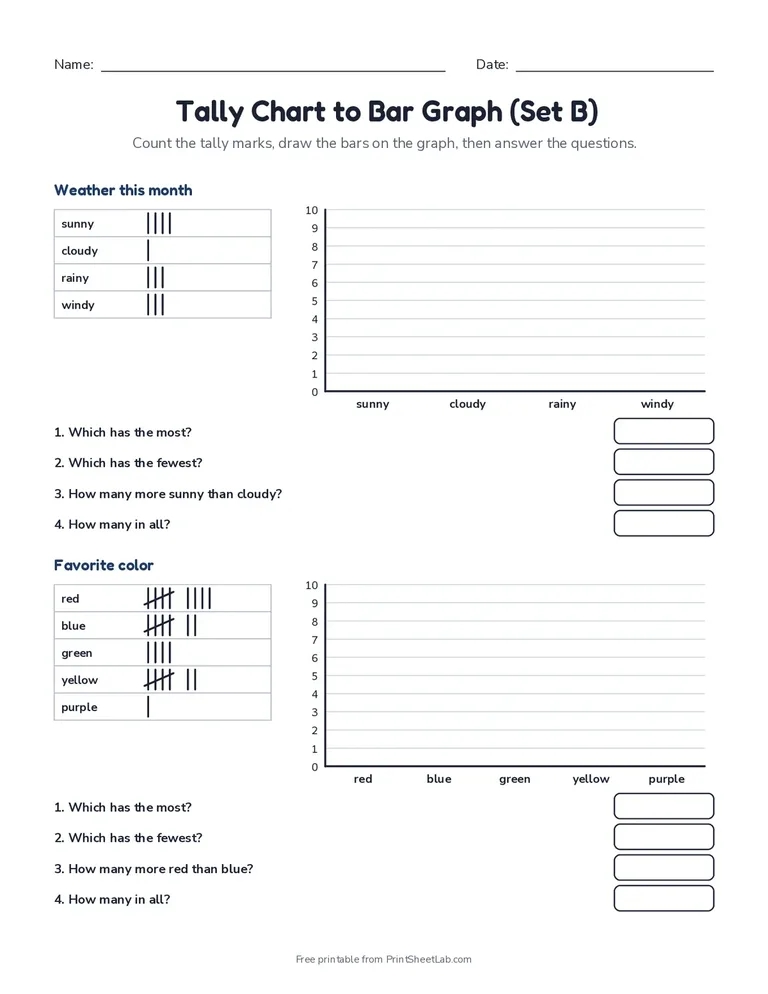
From counting to data
Graphs turn a pile of counts into a picture that answers questions at a glance. Children first collect data with tally marks (bundled in fives), then show it as a picture graph or a bar graph, and finally read graphs to compare: which is the most popular, and how many more? In grade 5, the coordinate grid adds a new kind of graph: points located by two numbers.
Graphing by grade
| Grade | What children practice |
|---|---|
| Grades 1 and 2 | Tally charts, picture graphs and bar graphs with up to four categories (1.MD.C.4, 2.MD.D.10) |
| Grade 3 | Scaled picture and bar graphs, “how many more” questions (3.MD.B.3) |
| Grade 5 | Plotting points on a coordinate grid (5.G.A.1) |
How to read a bar graph in 4 steps
- Read the title: what is the graph about?
- Read the labels on both axes: what is being counted, and in what units?
- Check the scale: does each line count by 1, 2, 5 or 10?
- Find the top of each bar and read across to the scale.
Worked example
A class voted for their favorite fruit: apples 8, bananas 5, grapes 7 and mangoes 10.
- Most popular: mangoes (10 votes).
- How many more voted for mangoes than bananas? 10 − 5 = 5 more.
- How many children voted in total? 8 + 5 + 7 + 10 = 30.
- With a scale that counts by 2, the banana bar ends halfway between 4 and 6.
Make a class graph together
Ask a question with three or four answers (favorite pet, how we get to school), collect tally marks, then turn the tally into a picture graph and a bar graph on the same data. Children see that all three show the same information in different ways.
Common mistakes
- Ignoring the scale and counting each line as 1.
- Reading the side of a bar instead of its top.
- Forgetting the key on a picture graph (each picture may stand for 2 or more).
- Drawing bars of different widths or with no gaps, which makes graphs hard to compare.
What is in the graphing worksheets
There are 20 graphing worksheets in three sets, each with an answer key:
- Tally charts and picture graphs (Grades 1 to 3, 6 worksheets)
- Reading bar graphs (Grades 2 and 3, 5 worksheets)
- Coordinate grids and pictures (Grades 4 and 5, 9 worksheets)
Tally chart worksheets: bundles of five
A tally chart records a count as it happens, one stroke for each item. Every fifth stroke crosses the four before it, so the marks make bundles of five and are quick to count by 5s. The tally chart worksheets in this section use this method, which is also a first lesson in skip counting. Here is how a count is read:
| Count | Groups of five | Extra marks | How to say it |
|---|---|---|---|
| 7 | 1 | 2 | 1 fives and 2 more |
| 12 | 2 | 2 | 2 fives and 2 more |
| 18 | 3 | 3 | 3 fives and 3 more |
| 23 | 4 | 3 | 4 fives and 3 more |
| 31 | 6 | 1 | 6 fives and 1 more |
The idea is very old, and appears in many cultures. Wikipedia’s article on tally marks describes the different systems.
Picture graph worksheets: what does each picture stand for?
A picture graph uses a small picture for a number of items, and the key tells you how many. Picture graph worksheets for grade 1 use one picture for each item, and grade 2 and 3 worksheets use one picture for 2, 5 or 10. When the key counts by 2 and the data is odd, the graph shows a half picture. Look at the fruit votes from the worked example above:
| Fruit | Votes | Pictures if one picture = 2 votes | Pictures if one picture = 1 vote |
|---|---|---|---|
| Apples | 8 | 4 | 8 |
| Bananas | 5 | 2.5 (a half picture) | 5 |
| Grapes | 7 | 3.5 (a half picture) | 7 |
| Mangoes | 10 | 5 | 10 |
The mangoes (10 votes) get five pictures with a key of 2, and the bananas (5 votes) get two and a half. Reading the key before counting the pictures is the habit that picture graph worksheets build.
Bar graph worksheets: choosing a scale
A bar graph needs a scale on its axis, and the best scale depends on the largest value. A scale that is too small makes the graph too tall to fit, and a scale that is too big makes the bars hard to read. This table shows a scale for six largest values, with the number of gridlines it needs:
| Largest value | Scale to use | Number of gridlines | Axis runs from |
|---|---|---|---|
| 9 | 1 | 9 | 0 to 9 |
| 18 | 2 | 9 | 0 to 18 |
| 30 | 5 | 6 | 0 to 30 |
| 60 | 5 | 12 | 0 to 60 |
| 100 | 10 | 10 | 0 to 100 |
| 250 | 50 | 5 | 0 to 250 |
Bar graph worksheets that ask children to choose a scale are a step above those that give it, and the answer key shows a scale that works. Wikipedia’s bar chart article shows the other types of bar graphs, such as the grouped bar chart.
Reading data: most, least and how many more
The questions on the graphing worksheets follow the same pattern. With the votes above (apples 8, bananas 5, grapes 7, mangoes 10), a child can answer: which fruit has the most votes (mangoes), which has the fewest (bananas), how many more votes mangoes have than bananas (10 − 5 = 5), and how many votes in all (30). The Common Core calls this “solving problems using information presented in a graph” (2.MD.D.10).
Coordinate grid worksheets: plotting points
A coordinate grid has two number lines at right angles. A point is written as (x, y): the first number says how far to go across, and the second says how far to go up. In grade 5 children use only the first quadrant, where both numbers are positive (5.G.A.1). To draw a mystery picture, plot a list of points and join them in order. The points below make a house:
| Point | Start at (0, 0), then | Joined to |
|---|---|---|
| (2, 1) | go 2 right and 1 up | the start |
| (2, 5) | go 2 right and 5 up | the point before it |
| (5, 8) | go 5 right and 8 up | the point before it |
| (8, 5) | go 8 right and 5 up | the point before it |
| (8, 1) | go 8 right and 1 up | the point before it |
| (2, 1) | go 2 right and 1 up | the point before it |
Coordinate grid worksheets in the third set give the points and ask children to find the picture. You can also make your own with the coordinate plane generator, and print blank grids from the graph paper with x and y axis page.
Graphing practice: read a graph with these five questions
Graph reading practice is the quickest way to improve graphing skills. A class voted for a favorite pet:
| Pet | Votes |
|---|---|
| Dogs | 12 |
| Cats | 9 |
| Fish | 5 |
| Birds | 3 |
Draw a bar graph or picture graph of the votes, then answer the questions, which are a short graphing review worksheet. The answers are below:
| Question | Answer |
|---|---|
| Which pet got the most votes? | Dogs (12) |
| Which pet got the fewest votes? | Birds (3) |
| How many votes in all? | 12 + 9 + 5 + 3 = 29 |
| How many more votes did dogs get than cats? | 12 – 9 = 3 |
| How many votes did fish and birds get together? | 5 + 3 = 8 |
Graph worksheets, graphing worksheets pdf and data and graphing worksheets
This page is also searched as graph worksheets, graphs practice, graph practice, graphing worksheet, graphing worksheets pdf, practice graphing worksheets, graphing practice worksheets, data and graphing worksheets, data and graphs worksheets, graphs and data worksheets, free graphing worksheets, free printable graphing worksheets and graph reading practice. All are the free PDFs above, with answer keys, and no sign-up.
Frequently asked questions
5 quick answers
Why bundle tally marks in fives?
Groups of five are quick to count by 5s, and the crossing line stops children losing their place.
What is a scaled picture graph?
A picture graph where each picture stands for more than one, such as each circle = 2. Half a picture would stand for 1.
What is the difference between a bar graph and a line graph?
A bar graph compares separate groups (fruits, pets). A line graph shows how one thing changes over time (temperature through a day).
What graphs do children learn in grade 2?
Picture graphs and bar graphs with up to four categories, answering “how many more” and “how many less” questions.
Where can I download free graphing worksheets?
Open any worksheet on this page or on a topic page, choose US Letter or A4, then print or save the PDF. All are free, with answer keys.