Semi-log graph paper has an even scale across and a logarithmic scale up the side, so a quantity that grows or shrinks by the same factor each step plots as a straight line. These free printable semi-log graph paper sheets have 1 to 5 cycles, with the lines spaced exactly by logarithms. Pick the number of cycles, the color and the paper size, then print the PDF.
Semi-log graph paper to print (PDF)
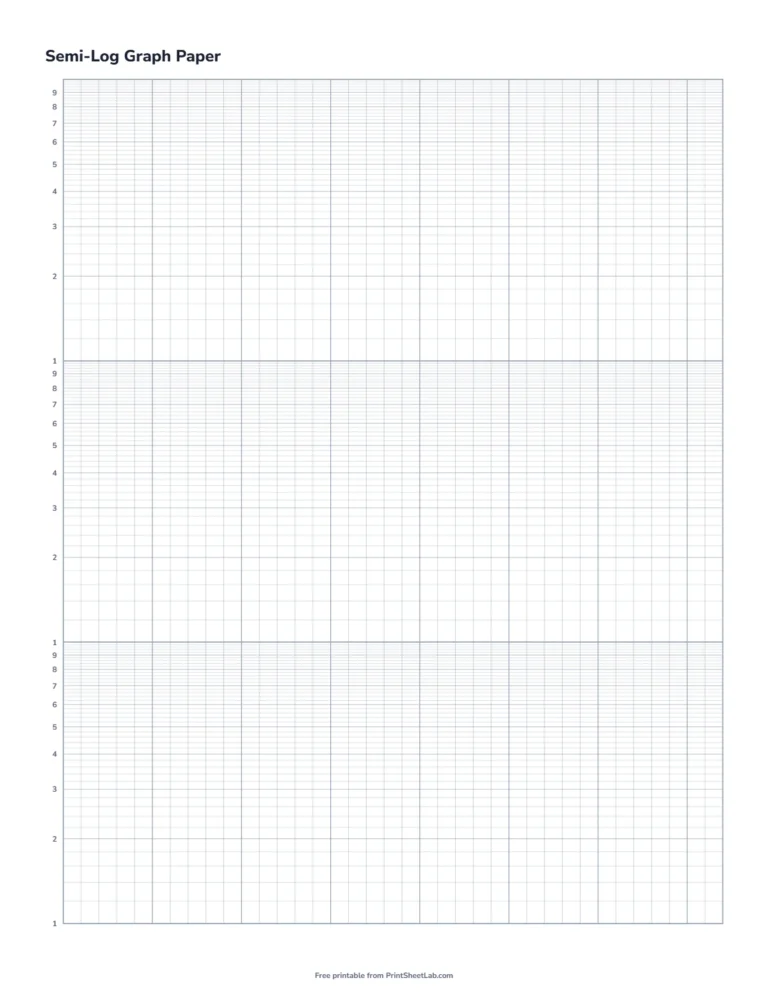
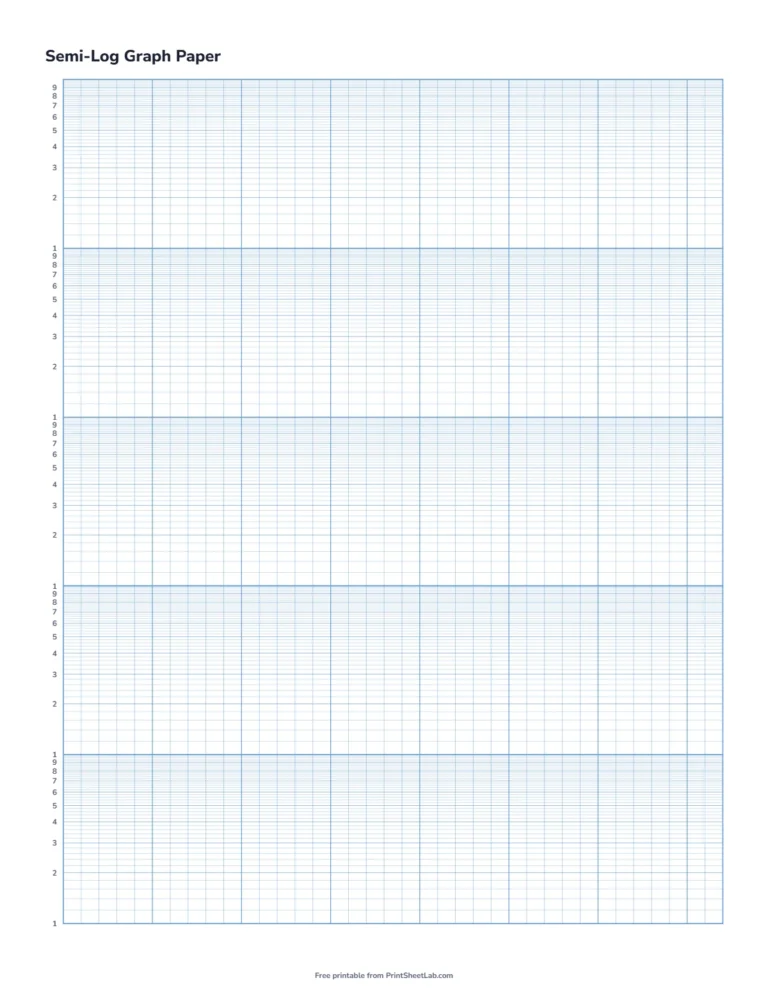
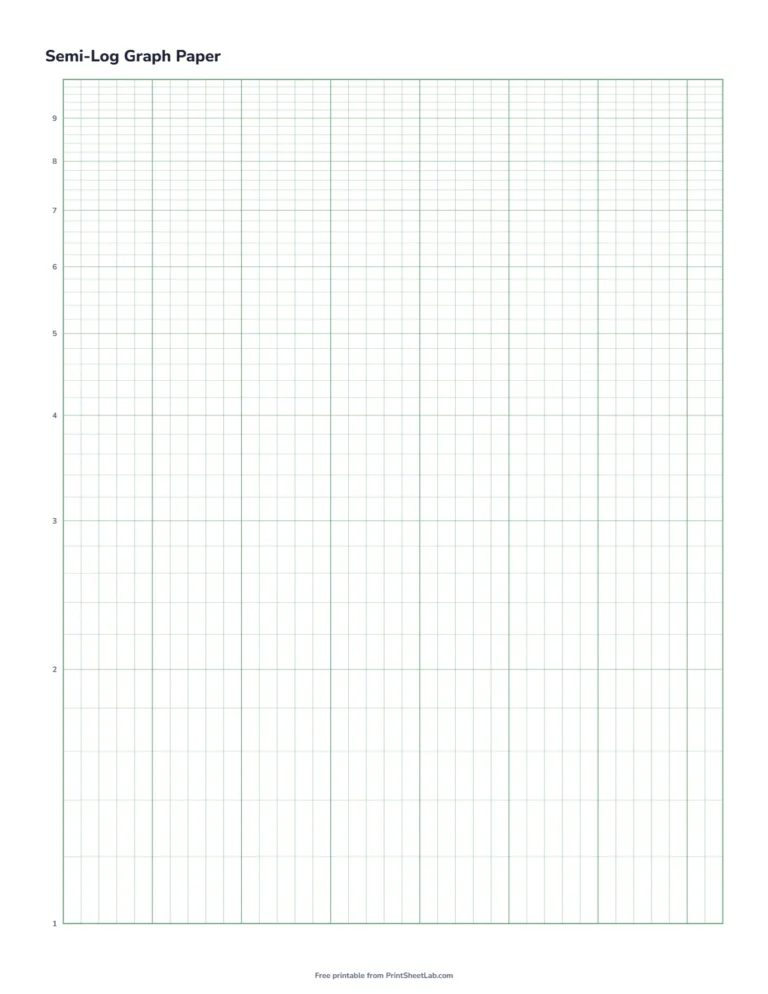
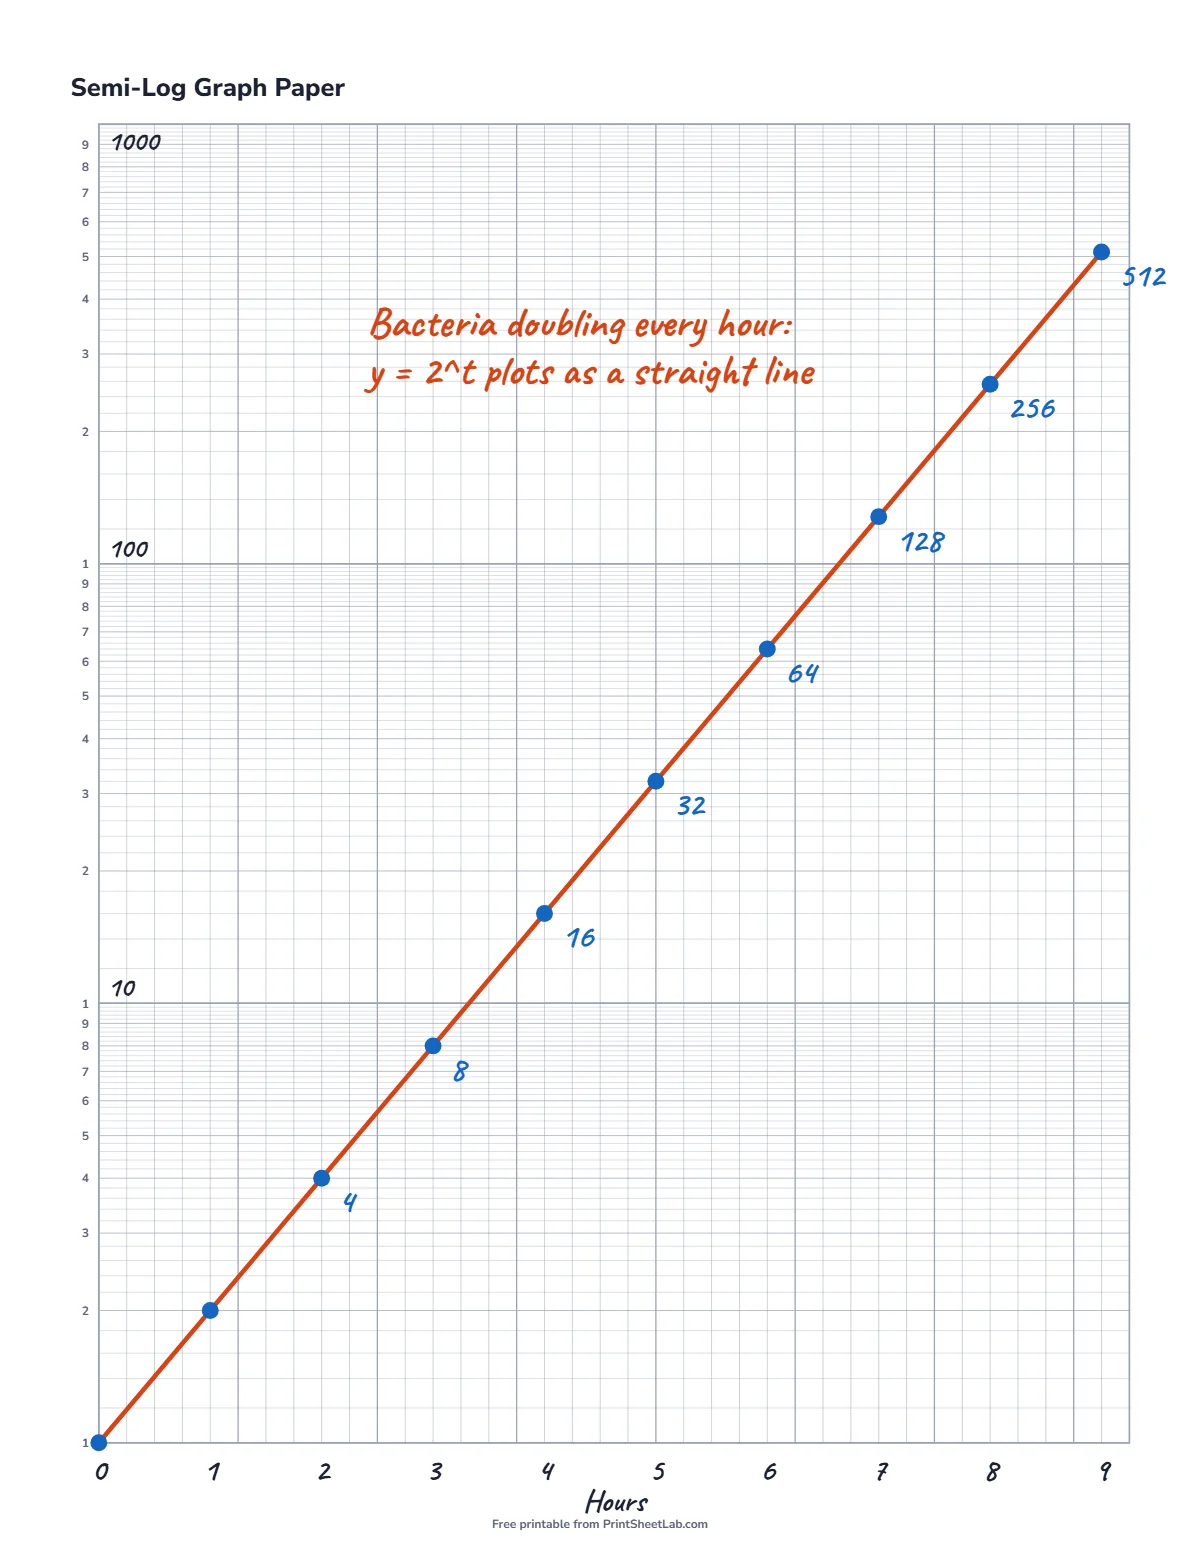
These four pages show the choices: a 3 cycle sheet, a 5 cycle sheet, a single cycle and a worked example of bacteria doubling every hour. Click a picture for the PDF, or use the generator above to choose the cycles and the color.
What is semi-log graph paper?
On semi-log graph paper, the horizontal lines are not evenly spaced. The gap between 1 and 2 is wide, and the gap between 8 and 9 is narrow, because each line sits at the logarithm of its value. The vertical lines are evenly spaced, and you use them for time or any other quantity that goes up in equal steps. Each group of lines from 1 to 10 is one cycle, and one cycle covers one power of ten. Wikipedia explains the idea in its semi-log plot article.
How the lines are spaced on semi-log graph paper
Within one cycle, a number d sits at a height of log₁₀(d) times the cycle height. That makes the spacing identical in every cycle, so 20 sits in the same place in cycle 2 as 2 does in cycle 1. This table shows the position of every number from 1 to 9, and the distance in inches on a 3 cycle sheet, where one cycle is 3.11 inches tall:
| Number | log₁₀ | Distance up the cycle, as a share of its height | Inches up a 3-cycle sheet |
|---|---|---|---|
| 1 | 0.000 | 0.0% | 0.00 in |
| 2 | 0.301 | 30.1% | 0.94 in |
| 3 | 0.477 | 47.7% | 1.49 in |
| 4 | 0.602 | 60.2% | 1.87 in |
| 5 | 0.699 | 69.9% | 2.18 in |
| 6 | 0.778 | 77.8% | 2.42 in |
| 7 | 0.845 | 84.5% | 2.63 in |
| 8 | 0.903 | 90.3% | 2.81 in |
| 9 | 0.954 | 95.4% | 2.97 in |
Notice that 3 is almost halfway up the cycle, and 5 is about 70% of the way. Anything between 1 and 3 takes up nearly half the height.
How many cycles do you need on semi log graph paper?
When you choose semi log graph paper, count the powers of ten between your smallest and largest value. Data from 3 to 4,000 spans a factor of about 1,300, which is more than 1,000 and less than 10,000, so you need 4 cycles. More cycles give a wider range, but each one is shorter, so readings are less precise. This table lists the cycle height on a Letter sheet:
| Cycles | Value range if you start at 1 | Height of one cycle | Choose when your largest value is about |
|---|---|---|---|
| 1 | 1 to 10 | 9.34 in (23.7 cm) | up to 10 times the smallest |
| 2 | 1 to 100 | 4.67 in (11.9 cm) | up to 100 times the smallest |
| 3 | 1 to 1,000 | 3.11 in (7.9 cm) | up to 1,000 times the smallest |
| 4 | 1 to 10,000 | 2.33 in (5.9 cm) | up to 10,000 times the smallest |
| 5 | 1 to 100,000 | 1.87 in (4.7 cm) | up to 100,000 times the smallest |
You label the first line of each cycle yourself. For three cycles, you might label the thick lines 1, 10, 100 and 1,000, or 0.1, 1, 10 and 100. The scale only has to change by a factor of ten from one thick line to the next.
Semi log graph paper example: bacteria doubling every hour
If a culture starts with one cell and doubles every hour, the number of cells after t hours is 2t. On ordinary graph paper the points curve upward faster and faster. On semi-log graph paper they fall on one straight line, as the filled example shows. Here are the values:
| Hours | Bacteria (doubling each hour) | Height on the paper |
|---|---|---|
| 0 | 1 | Cycle 1 |
| 1 | 2 | Cycle 1 |
| 2 | 4 | Cycle 1 |
| 3 | 8 | Cycle 1 |
| 4 | 16 | Cycle 2 |
| 5 | 32 | Cycle 2 |
| 6 | 64 | Cycle 2 |
| 7 | 128 | Cycle 3 |
| 8 | 256 | Cycle 3 |
| 9 | 512 | Cycle 3 |
The line crosses a full cycle about every 3.3 hours, because 23.32 is 10. That is the reason the slope tells you the growth rate directly.
Exponential growth graph paper: finding the growth factor from two points
A log graph paper line gives you the growth factor directly. If your data is exponential, y = a·bx, pick two points on the line, (x₁, y₁) and (x₂, y₂). The growth factor for each step in x is b = (y₂ ÷ y₁)1 ÷ (x₂ − x₁). For the bacteria, take (2, 4) and (8, 256): b = (256 ÷ 4)1/6 = 641/6 = 2. So the culture doubles every hour. If the line slopes downward, b is less than 1, and the quantity is decaying.
Semi-log paper printable for decay: carbon-14 half-life
Radioactive decay is exponential, so it plots as a straight line that falls as time goes on. Carbon-14 has a half-life of about 5,730 years. This table shows how much is left:
| Half-lives | Years (carbon-14) | Fraction left | Percent left |
|---|---|---|---|
| 0 | 0 | 1/1 | 100% |
| 1 | 5,730 | 1/2 | 50% |
| 2 | 11,460 | 1/4 | 25% |
| 3 | 17,190 | 1/8 | 12.5% |
| 4 | 22,920 | 1/16 | 6.25% |
| 5 | 28,650 | 1/32 | 3.125% |
| 6 | 34,380 | 1/64 | 1.5625% |
After six half-lives, which is 34,380 years, only about 1.6% of the carbon-14 remains. On semi-log paper this runs over about two cycles, from 100% down to 1.6%, with the points on a straight line.
How long to double? Growth rates on semi-log graph paper
For money or populations growing at a steady percentage, the doubling time is ln 2 ÷ ln(1 + r). The “rule of 72” is a quick estimate: divide 72 by the percentage. They agree closely for rates between 5% and 10%:
| Growth rate per year | Exact doubling time | Rule of 72 estimate |
|---|---|---|
| 1% | 69.7 years | 72.0 years |
| 2% | 35.0 years | 36.0 years |
| 3% | 23.4 years | 24.0 years |
| 5% | 14.2 years | 14.4 years |
| 7% | 10.2 years | 10.3 years |
| 10% | 7.3 years | 7.2 years |
Other uses for logarithmic graph paper
- Science: pH, decibels and the Richter scale are logarithmic, and a log scale shows values that differ by thousands on a single graph.
- Electronics: a Bode plot of a filter puts frequency on the log scale. Turn the sheet sideways to put the log axis across the page.
- Medicine and biology: bacterial growth curves, drug concentration over time, and the spread of a disease in its early weeks.
- Finance: long-term price charts often use a log scale so that equal percentage changes look the same size.
If both of your axes need a log scale, use log-log graph paper. For plain squares, see graph paper.
Printing tip
Print at 100% or “Actual size” and turn off “Fit to page”, so every measurement on the sheet is exact. Choose Letter or A4 paper in the generator before you download the PDF.
Semi-log graph paper: frequently asked questions
What is a cycle on semi-log graph paper?
A cycle covers one power of ten, such as 1 to 10 or 10 to 100. A 3 cycle sheet covers a factor of 1,000 from the bottom to the top.
Why are the lines not evenly spaced?
Each line is placed at the logarithm of its value, so the gap from 1 to 2 is wider than the gap from 8 to 9. This is what makes exponential growth plot as a straight line.
How do I choose between 1, 3 and 5 cycles?
Use enough cycles to cover your data. One cycle is a factor of 10, three cycles are a factor of 1,000 and five cycles are a factor of 100,000.
When should I use log-log paper instead?
Use log-log paper for power relationships such as y = axn, where both axes need a log scale. Use semi-log paper for exponential relationships.
Is this semi-log graph paper free?
Yes. It is free to print for home and classroom use, with no sign-up.
More printable paper
- Specialty paper generator with every layout on this site
- Paper generator for lined, graph, dot grid, isometric and handwriting paper
- Graph paper, lined paper and dot grid paper