Print free graph paper with x and y axis in seconds. Each grid is a coordinate plane with arrows and numbered axes, and you can fit 1, 2 or 4 graphs on a page. Choose the square size, line color and paper size, then download a PDF for US Letter, A4 or A5.
New: print ready-made coordinate plane mystery pictures and four quadrant grids with answer keys.
Graph paper with x and y axis to print (PDF)
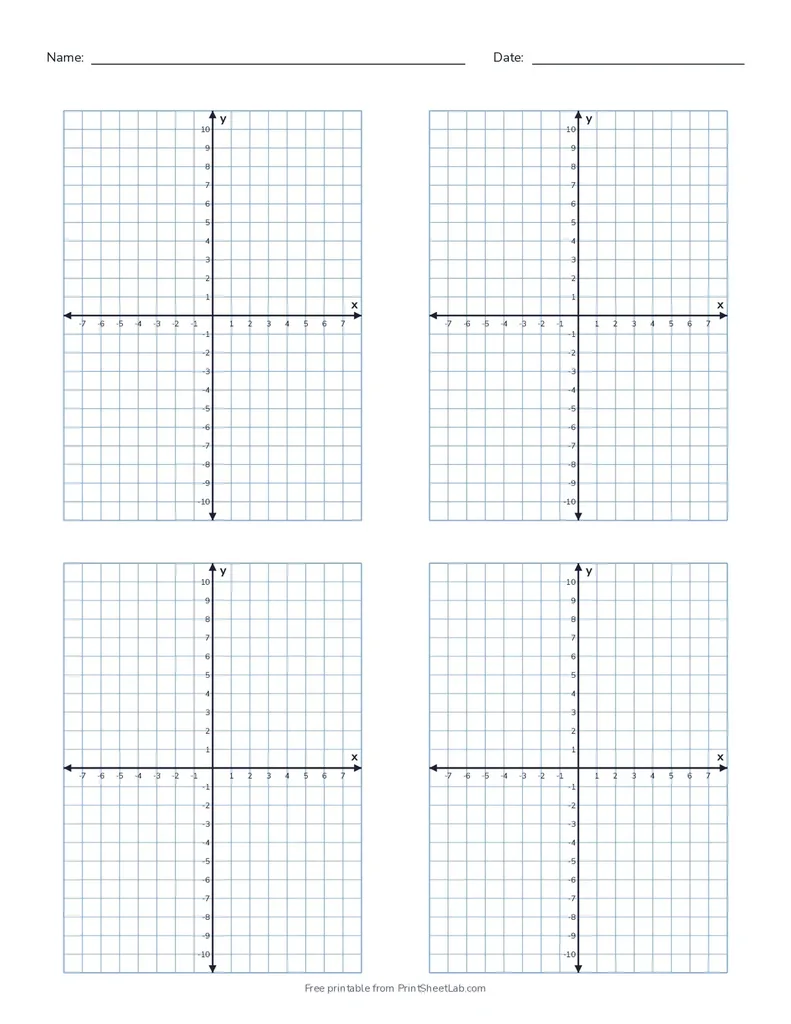
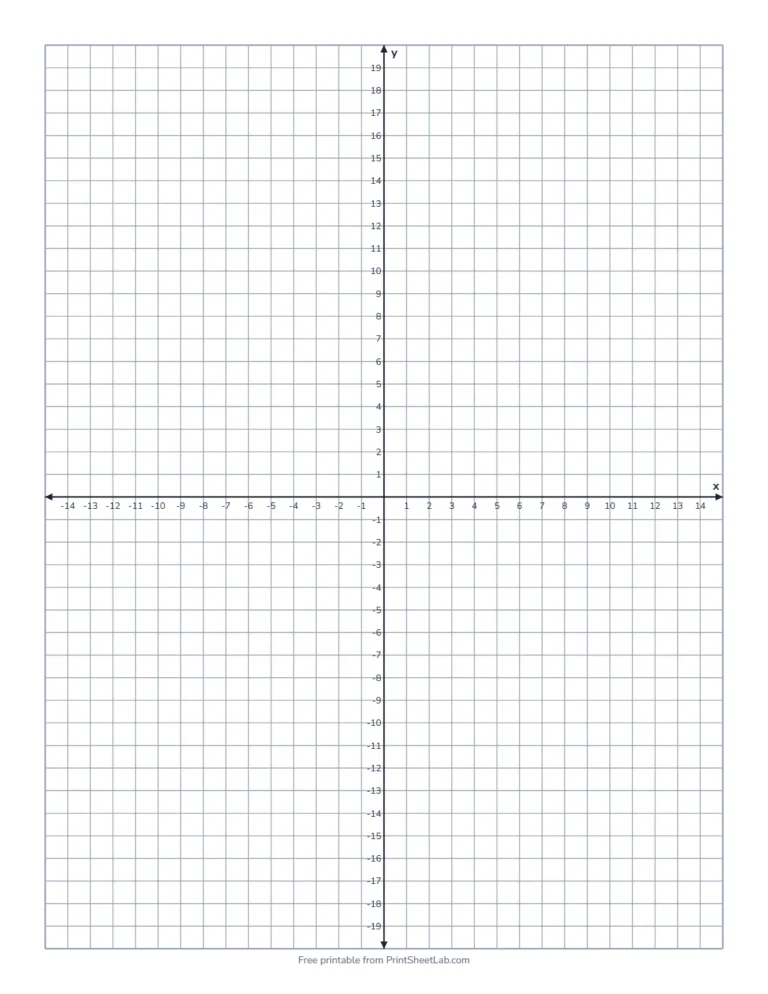
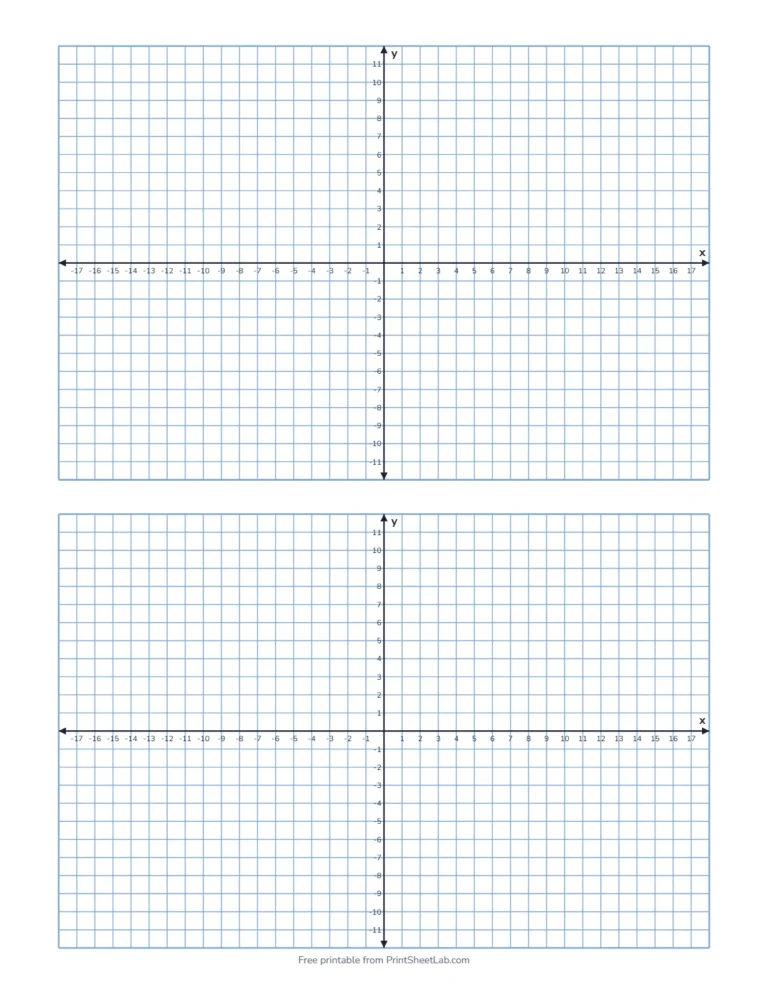
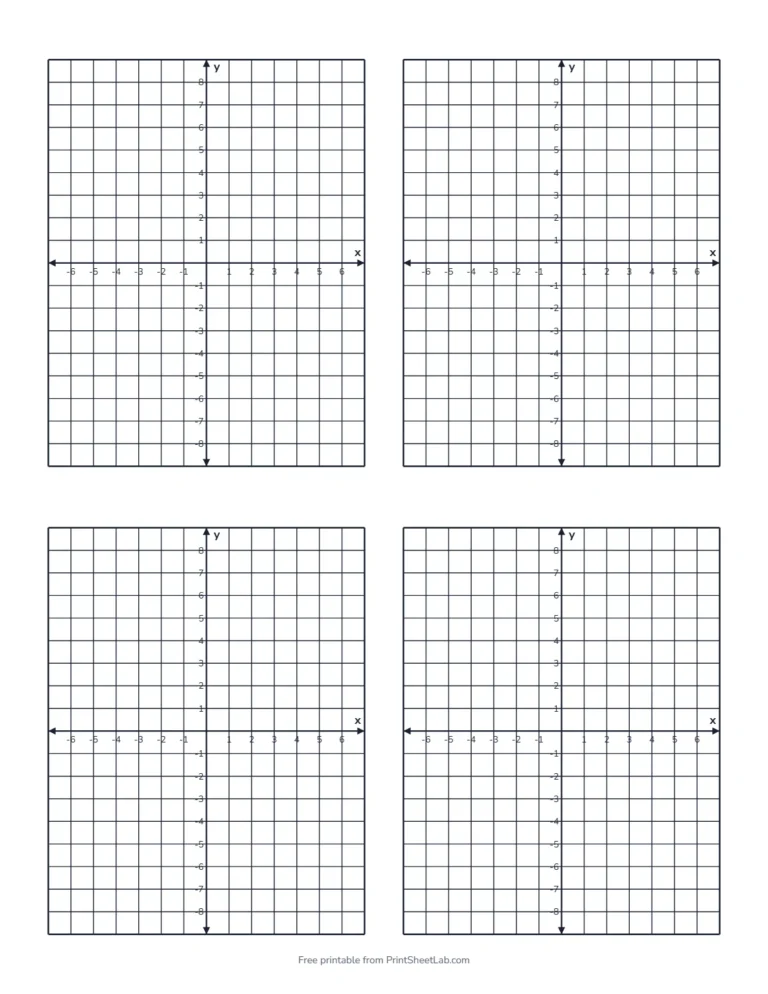
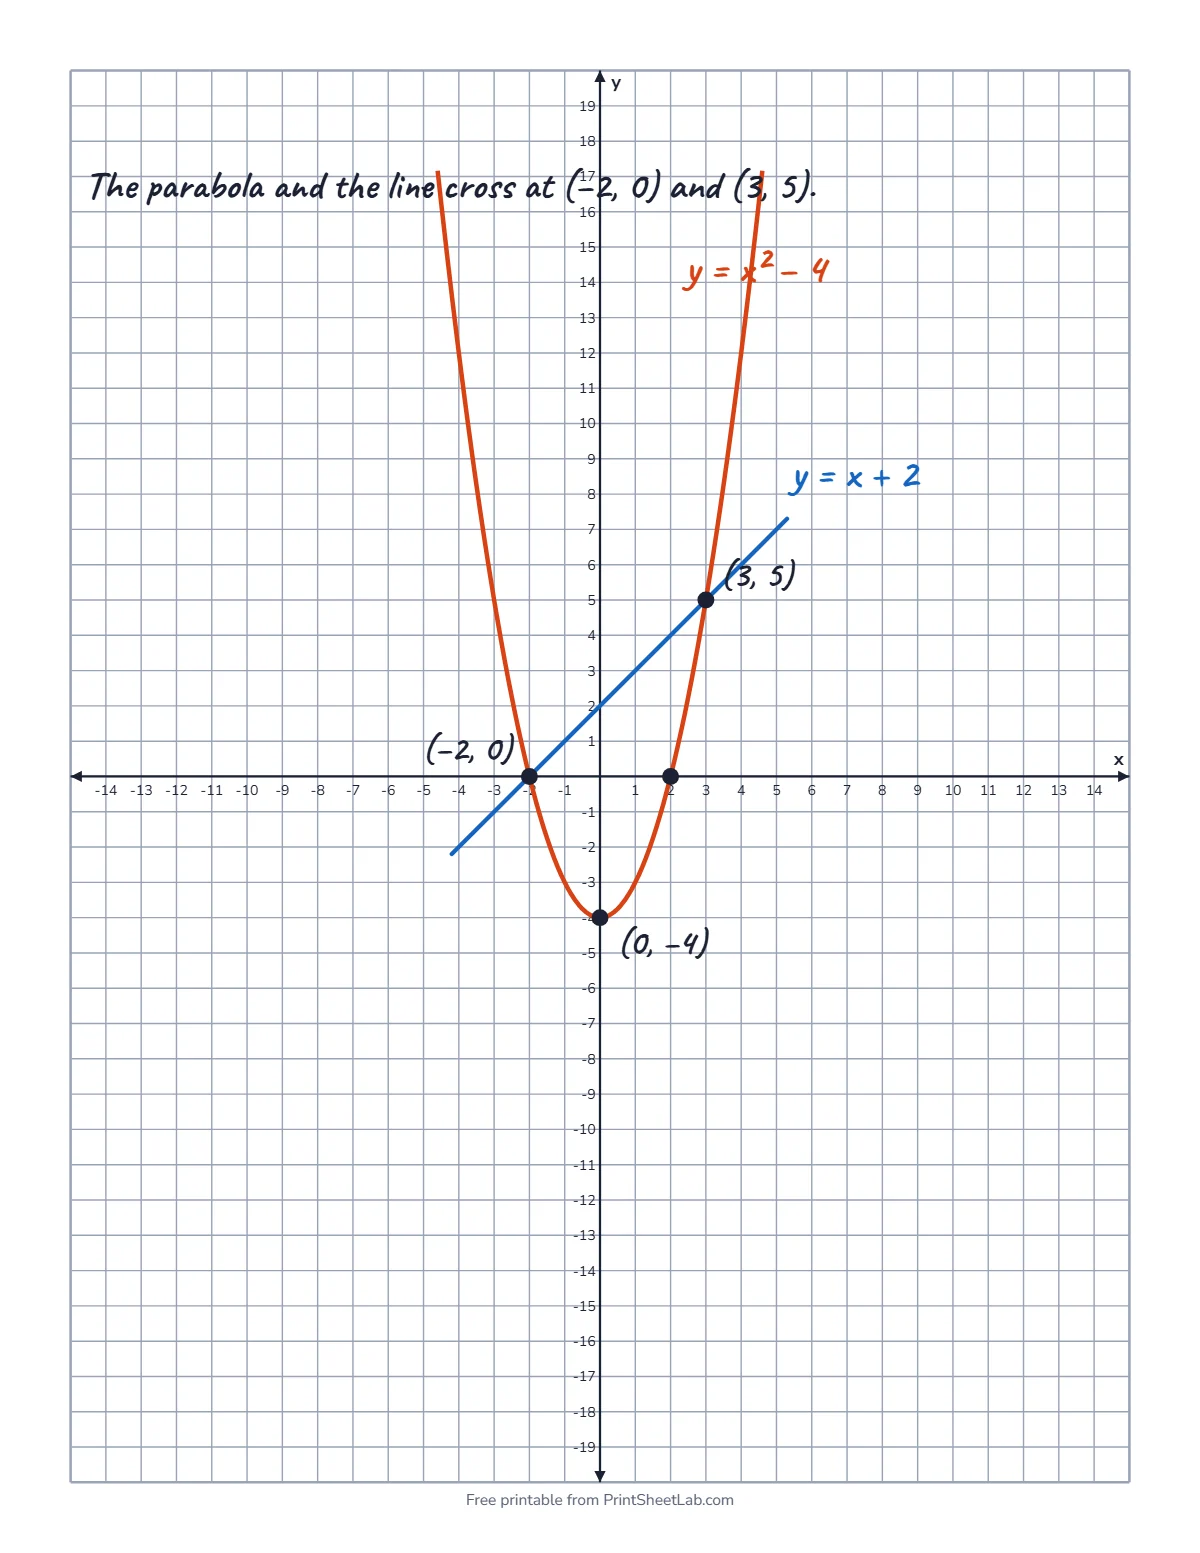
These four pages show more choices: one numbered graph on a page, two graphs with 1/5 inch squares in blue, four graphs with 1/4 inch squares, and a worked example with a parabola and a line. Click a picture for the PDF, or use the generator above to choose the layout and the square size.
What is coordinate plane graph paper?
Coordinate plane graph paper is graph paper with a horizontal x-axis and a vertical y-axis crossing in the middle at the origin (0, 0). The axes split the grid into four quadrants, so you can plot positive and negative points and graph lines, parabolas and other functions.
X y axis graph paper printable: choose the right layout
Every x y axis graph paper printable sheet has the same numbered axes, and the layout decides how many graphs fit.
| Graphs per page | Numbered range on US Letter (1/5 inch squares, no name line) | Best for |
|---|---|---|
| 1 | About -17 to 17 across and -24 to 24 up | Graphing functions and large plots |
| 2 | About -17 to 17 across and -11 to 11 up | Comparing two graphs, homework pairs |
| 4 | About -7 to 7 across and -11 to 11 up | Practice sets, quizzes and warm-ups |
Bigger squares give fewer, larger numbers; smaller squares give a wider range. The preview shows the exact range before you print.
The four quadrants on graph paper with x and y axis
The axes of the graph paper with x and y axis divide the plane into four quadrants, numbered counterclockwise from the top right. The Wikipedia article on the Cartesian coordinate system explains how René Descartes’ idea of coordinates joined algebra and geometry. The signs of the coordinates tell you the quadrant:
| Quadrant | Signs of x and y | Example point |
|---|---|---|
| I (top right) | x positive, y positive | (3, 2) |
| II (top left) | x negative, y positive | (−3, 2) |
| III (bottom left) | x negative, y negative | (−3, −2) |
| IV (bottom right) | x positive, y negative | (3, −2) |
| On an axis | x = 0 or y = 0 | (0, 4) or (−5, 0) |
How to plot points on a coordinate plane
- Start at the origin, where the axes cross.
- Move right for a positive x value or left for a negative one.
- From there, move up for a positive y value or down for a negative one.
- Mark the point and label it with its coordinates, for example (3, -2).
What each square can stand for
You are not limited to one unit per square. If your numbers are big, let each square stand for 2, 5 or 10. This table shows the range you can cover on a single graph on US Letter with 1/5 inch squares:
| Each square stands for | Range across, 1 graph per page | Range up, 1 graph per page |
|---|---|---|
| 1 | −17 to 17 | −24 to 24 |
| 2 | −34 to 34 | −48 to 48 |
| 5 | −85 to 85 | −120 to 120 |
| 10 | −170 to 170 | −240 to 240 |
Label the scale on the axis, for example “1 square = 5”, so that your graph can be read later.
Example: where a parabola and a line cross
The filled example above plots y = x² − 4 and y = x + 2 on one set of axes. First make a table of values:
| x | -4 | -3 | -2 | -1 | 0 | 1 | 2 | 3 | 4 |
|---|---|---|---|---|---|---|---|---|---|
| y = x² − 4 | 12 | 5 | 0 | -3 | -4 | -3 | 0 | 5 | 12 |
| y = x + 2 | -2 | -1 | 0 | 1 | 2 | 3 | 4 | 5 | 6 |
Plot each pair, and join the points with a smooth curve and a straight line. They cross at (−2, 0) and (3, 5), and you can check this with algebra: setting x² − 4 = x + 2 gives x² − x − 6 = 0, which factors as (x − 3)(x + 2) = 0. Graph paper with x and y axis lets students see why an equation of degree two has two solutions.
Coordinate grid paper and the Common Core standards
Students work with the coordinate plane from grade 5 to high school. This table matches some common skills with the standards:
| Grade | Skill with a coordinate plane | Standard |
|---|---|---|
| 5 | Graph points in the first quadrant | 5.G.A.1 and 5.G.A.2 |
| 6 | Plot points in all four quadrants | 6.NS.C.6 |
| 6 | Find the distance between points on the same row or column | 6.NS.C.8 |
| 8 | Graph proportional relationships and lines | 8.EE.B.5 and 8.F.A.3 |
Coordinate picture activity
A mystery picture is a favorite way to practice with graph paper with x and y axis. Write a list of points in order, such as (2, 1), (2, 5), (5, 8), (8, 5), (8, 1) and back to (2, 1). Students plot each point and join them in order to reveal a house. Use all four quadrants for a bigger picture, and ask students to write their own list of points for a partner to plot. For ready-made pictures with answer keys, try the {I(‘/coordinate-plane/’, ‘coordinate plane generator’)}.
Ideas for teachers
- Four graphs per page make quick warm-ups: one equation per grid.
- Use one large graph for coordinate picture activities, where points joined in order make a picture.
- Print on A4 or Letter with a name and date line for homework.
- Give each student a sheet of graph paper with x and y axis, and ask them to plot a secret picture for a partner to find.
Frequently asked questions
4 quick answers
What is graph paper with x and y axis called?
It is usually called coordinate plane paper, coordinate grid paper or Cartesian graph paper.
Can I get graph paper with numbers on the axes?
Yes. “Number the axes” is on by default. Turn it off if students should write the numbers themselves.
How many graphs can I fit on one page?
1, 2 or 4. Four graphs per page is the most popular choice for practice worksheets.
Is it free?
Yes, with no sign-up and no watermark.
More printable paper
- Graph paper in every common square size.
- Printable paper maker for lined, dot grid and handwriting paper.