A standard deviation calculator measures how spread out a list of numbers is around its mean. Paste your numbers, choose sample or population, and this free standard deviation calculator shows the standard deviation, variance, mean, sum of squares, standard error and a table of every deviation, with the working in plain steps.
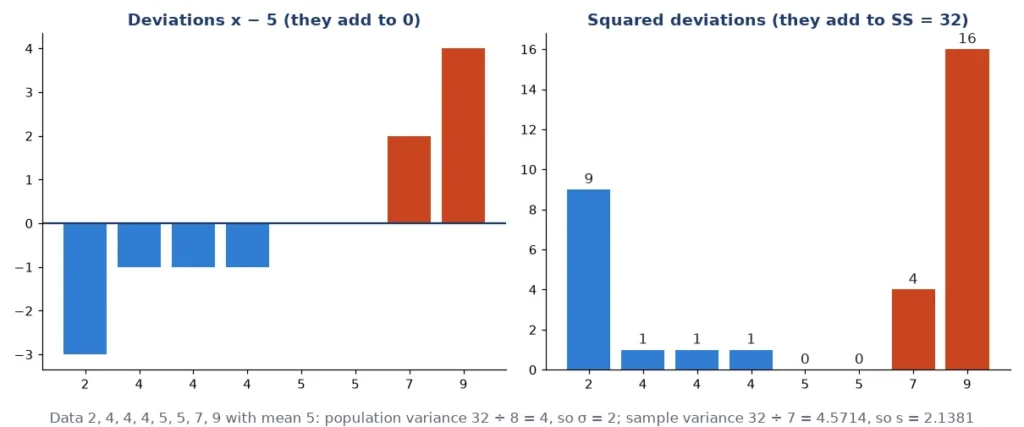
Quick answer: for 2, 4, 4, 4, 5, 5, 7, 9 the mean is 5 and the squared deviations add up to 32. The population standard deviation is √(32 ÷ 8) = 2, and the sample standard deviation is √(32 ÷ 7) ≈ 2.1381. Use n − 1 when your numbers are a sample, and n when they are the whole group.
How to use this standard deviation calculator
Type or paste your numbers into the box, separated by commas, spaces or new lines, so a column copied from a spreadsheet works. The result updates as you type. Then pick the right setting for your data.
- Enter at least two numbers (one is enough for a population).
- Choose Sample (divide by n − 1) if the numbers are a sample drawn from a larger group, or Population (divide by n) if they are every value there is.
- Pick how many decimal places to show.
- Read the standard deviation, then open How it works for each step, or scan the deviations table.
| Result | What it tells you |
|---|---|
| Standard deviation | The typical distance of a value from the mean, in the same units as the data |
| Variance | The SD squared, the average squared distance from the mean |
| Mean and sum | The average and the total of the numbers |
| Sum of squares (SS) | The total of the squared deviations, the starting point for variance |
| Standard error | How precisely the sample mean estimates the true mean: s ÷ √n |
| Coefficient of variation | The SD as a percent of the mean, for comparing spreads |
| Deviations table | Each value, its difference from the mean and the square of that difference |
If you only need the average, middle value or most common number, use the mean, median and mode calculator; this page focuses on spread.
Standard deviation calculator with steps: how to read the working
Open How it works under the result and the standard deviation calculator with steps lists eight lines in the order a teacher expects: the count and sum, the mean, the deviations, the sum of squares, the variance with the divisor you chose, the square root, the standard error and the coefficient of variation.
Each line uses your own numbers, rounded only for display, so you can copy it into a lab report or homework. The table above the steps shows every deviation so you can spot a value that pulls the result up, which is often a typing error or an outlier.
Standard deviation formula and how it works
The standard deviation formula measures the typical distance from the mean. There are two versions, and the only difference is the divisor.
| Version | Formula | Use when |
|---|---|---|
| Population standard deviation (σ) | σ = √[ Σ(x − μ)² ÷ N ] | The data is the whole population, such as every student in a class |
| Sample standard deviation (s) | s = √[ Σ(x − x̄)² ÷ (n − 1) ] | The data is a sample used to estimate a larger group |
In both, x̄ or μ is the mean, Σ means “add up”, and the part inside the brackets is the variance. The work always runs in the same five steps: find the mean, subtract it from each value, square the differences, add them to get the sum of squares, divide by n or n − 1 and take the square root.
Example 1: population and sample standard deviation of 2, 4, 4, 4, 5, 5, 7, 9
- Count and add: n = 8 and Σx = 2 + 4 + 4 + 4 + 5 + 5 + 7 + 9 = 40.
- Mean: 40 ÷ 8 = 5.
- Deviations from 5: −3, −1, −1, −1, 0, 0, 2, 4 (they add to 0).
- Squares: 9, 1, 1, 1, 0, 0, 4, 16, so SS = 32.
- Population: variance = 32 ÷ 8 = 4, so σ = √4 = 2.
- Sample: variance = 32 ÷ 7 = 4.5714, so s = √4.5714 ≈ 2.1381.
The same data gives a standard error of 2.1381 ÷ √8 ≈ 0.7559 and a coefficient of variation of 2.1381 ÷ 5 = 42.76%. Six of the eight values (75%) fall within one standard deviation of the mean.
Example 2: test scores
Ten quiz scores are 72, 85, 90, 68, 77, 95, 81, 88, 74 and 80. The sum is 810 and the mean is 81. The squared deviations add to SS = 658. If these ten students are the whole class, σ = √(658 ÷ 10) = √65.8 ≈ 8.1117. If they are a sample of a bigger year group, s = √(658 ÷ 9) = √73.1111 ≈ 8.5505. The standard error of the mean is 2.7039.
Example 3: a small sample, 4, 8, 6, 5, 3
The sum is 26, so the mean is 26 ÷ 5 = 5.2. The deviations are −1.2, 2.8, 0.8, −0.2 and −2.2, and their squares are 1.44, 7.84, 0.64, 0.04 and 4.84, which add to SS = 14.8. As a sample the variance is 14.8 ÷ 4 = 3.7 and s = 1.9235. As a population it is 14.8 ÷ 5 = 2.96 and σ = 1.7205. The standard error is 0.8602 and the coefficient of variation is 36.99%.
Sample standard deviation vs population standard deviation
Use the population standard deviation when your list contains every member of the group you care about, such as the final marks of one class. Use the sample standard deviation when your list is only part of a larger group and you want to estimate that group’s spread. A sample tends to underestimate the true spread, because its values cluster around their own mean rather than the true mean. Dividing by n − 1 instead of n, known as Bessel’s correction, fixes that bias for the variance.
The gap between the two shrinks as the sample grows. The sample SD is the population SD multiplied by √(n ÷ (n − 1)):
| Number of values n | Sample SD ÷ population SD | Difference |
|---|---|---|
| 2 | 1.4142 | 41.42% |
| 3 | 1.2247 | 22.47% |
| 5 | 1.1180 | 11.80% |
| 10 | 1.0541 | 5.41% |
| 30 | 1.0171 | 1.71% |
| 100 | 1.0050 | 0.50% |
If you are not sure which to choose, the sample version is the safer default, and it is what Excel’s STDEV.S and most statistics courses use for data.
Variance calculator: variance and sum of squares
The variance is the SD squared, and the tool shows it for your chosen version. It is the average squared distance from the mean: SS ÷ n for a population and SS ÷ (n − 1) for a sample. Variance is harder to interpret because its units are squared, such as dollars squared, which is why the standard deviation is usually quoted. Variance is the quantity that adds up for independent measurements, which is why statisticians use it in formulas.
As a variance calculator it handles any list. For 10, 12, 23, 23, 16, 23, 21, 16 the mean is 18 and SS = 192, so the population variance is 192 ÷ 8 = 24 and the sample variance is 192 ÷ 7 = 27.4286. Their square roots are the standard deviations 4.899 and 5.2372. Use whichever matches your data, and keep the squared units in mind when you report a variance.
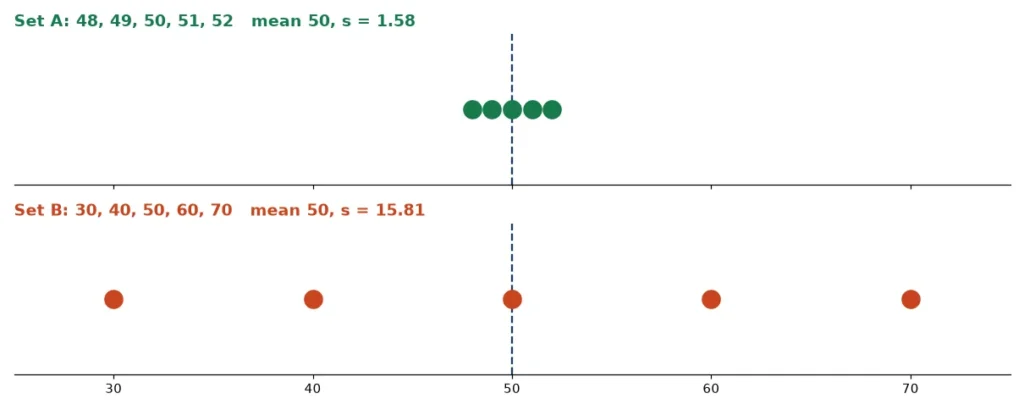
Two sets can share a mean and still be very different, as the chart shows: 48 to 52 has s = 1.5811 while 30 to 70 has s = 15.8114. The mean alone hides this, and the standard deviation reveals it.
The 68-95-99.7 rule: what a standard deviation means
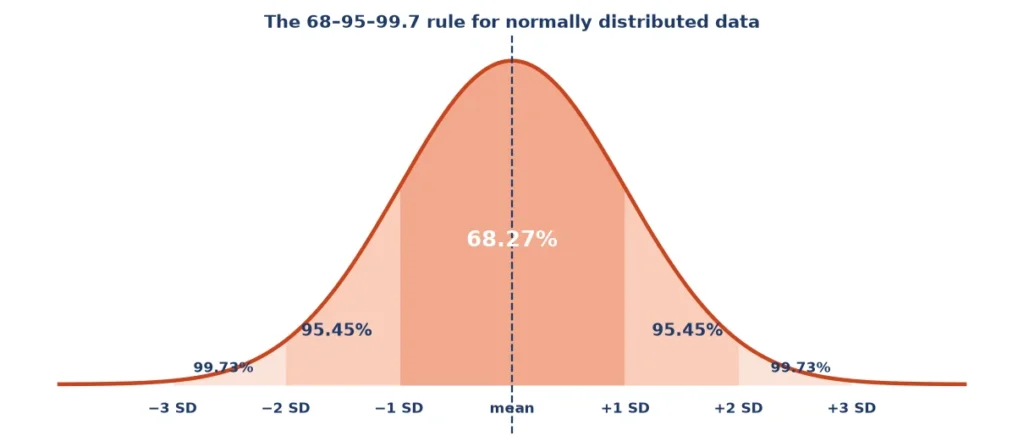
For data that is roughly bell-shaped, the empirical rule says about 68% of values lie within one standard deviation of the mean, 95% within two and 99.7% within three. For exam scores with a mean of 75 and a standard deviation of 10, about 68% of students scored between 65 and 85 and about 95% between 55 and 95.
| Range | Share of data | Scores (mean 75, SD 10) |
|---|---|---|
| Mean ± 1 SD | about 68.27% | 65 to 85 |
| Mean ± 2 SD | about 95.45% | 55 to 95 |
| Mean ± 3 SD | about 99.73% | 45 to 105 |
Your calculator result counts how many of your own values fall within one and two standard deviations, so you can compare your data with the rule. For skewed data the rule is only a rough guide. To measure how far a single value is from the mean in standard deviations, use the z-score calculator.
Standard error calculator: how precise is the mean?
The standard error of the mean is s ÷ √n. It tells you how much the sample mean would vary from sample to sample, so it shrinks as the sample gets bigger, while the standard deviation of the data itself does not. With s = 10 the standard error is 5 for 4 values, 2 for 25, 1 for 100 and 0.5 for 400. Quadrupling the sample halves the standard error. The standard error calculator part of this tool always uses the sample standard deviation.
Coefficient of variation: comparing different scales
The coefficient of variation is the standard deviation divided by the mean, as a percent. It lets you compare spread across data on different scales. A group with mean 50 and SD 5 has CV = 10%, while a group with mean 200 and SD 10 has CV = 5%, so the second is less variable in relative terms even though its SD is bigger. It only makes sense for data measured from a true zero, such as weights or prices, and it is undefined when the mean is 0.
Standard deviation vs variance vs standard error vs range
| Measure | Formula | Units | Best for |
|---|---|---|---|
| Range | max − min | Same as data | A quick look at spread, but it uses only two values |
| Variance | SS ÷ (n − 1) or SS ÷ n | Squared | Statistical formulas and ANOVA |
| Standard deviation | √variance | Same as data | Describing spread |
| Standard error | s ÷ √n | Same as data | Precision of the mean |
| Coefficient of variation | SD ÷ mean | Percent | Comparing different scales |
How to calculate standard deviation in Excel, Google Sheets and on a calculator
| Tool | Sample SD | Population SD |
|---|---|---|
| Excel | =STDEV.S(A1:A8) | =STDEV.P(A1:A8) |
| Google Sheets | =STDEV(A1:A8) | =STDEVP(A1:A8) |
| Scientific calculators (statistics mode) | s or σ(n−1) | σ or σn |
| TI-84 (1-Var Stats) | Sx | σx |
The labels vary between calculator brands, so check the manual. Use this standard deviation calculator to confirm your result and to see the steps, which a spreadsheet function does not show. For repeated values, such as a frequency table, type each value as many times as it occurs.
Where standard deviation is used
- School and exams: teachers use it to describe how spread out marks are and to standardize scores; a class with a mean of 72 and an SD of 5 is far more uniform than one with the same mean and an SD of 15.
- Science labs: repeated measurements are reported as mean ± SD, so a small SD means a precise method.
- Manufacturing: a bolt that must be 20 mm long is checked by its mean and SD; a large SD means inconsistent parts.
- Weather: two cities can both average 15 degrees, but the one with the larger SD has more extreme hot and cold days.
- Finance: volatility is the standard deviation of returns. This is general information, not financial advice.
Common mistakes with standard deviation
- Using n when you have a sample. Divide by n − 1 unless you have the whole population.
- Forgetting the square root. The variance is not the standard deviation.
- Rounding the mean too early. Keep full precision until the end.
- Expecting a negative answer. A standard deviation is never negative, and it is 0 only when all values are equal.
- Using it on very skewed data without care. The 68-95-99.7 rule needs a roughly bell-shaped distribution.
What is a good standard deviation?
There is no good or bad value on its own; it depends on the scale of the data and what you are measuring. An SD of 2 is huge for the weights of precision parts measured in grams and tiny for annual incomes. Compare it with the mean (the coefficient of variation) or with another group measured in the same units.
Frequently asked questions
11 quick answers
What is standard deviation?
Standard deviation is a measure of how spread out numbers are around their mean. A small value means the numbers are close to the mean; a large value means they are widely scattered.
How does a standard deviation calculator work?
It finds the mean, subtracts it from each value, squares the differences, adds them, divides by n or n − 1 and takes the square root. This standard deviation calculator shows each step and a table of the deviations.
What is the difference between sample and population standard deviation?
Population standard deviation divides the sum of squares by n and is used when you have every value. Sample standard deviation divides by n − 1 and is used when your data is a sample of a larger group.
Why do we divide by n − 1?
A sample is on average closer to its own mean than to the true mean, so dividing by n underestimates the spread. Dividing by n − 1, called Bessel’s correction, removes that bias in the variance.
Can standard deviation be negative?
No. It is a square root of an average of squares, so it is zero or positive. It equals zero only when every value is the same.
What is the standard deviation of 1 to 10?
For the numbers 1 to 10 the mean is 5.5 and the sum of squares is 82.5. The sample SD is 3.0277 and the population SD is 2.8723.
What is variance and how is it related?
Variance is the SD squared. For 2, 4, 4, 4, 5, 5, 7, 9 the population variance is 4 and the population standard deviation is 2.
How do I find the standard deviation from a frequency table?
Enter each value as many times as its frequency, separated by spaces or commas, and the calculator treats them as a normal list.
What does the standard error mean?
The standard error of the mean, s ÷ √n, shows how precisely a sample mean estimates the true mean. A larger sample gives a smaller standard error.
What is a standard deviation of 0?
It means all the values are identical, for example 5, 5, 5, 5. There is no spread at all.
Can I paste numbers from Excel?
Yes. Copy a column or row and paste it into the box. New lines, tabs, spaces and commas all separate the numbers.
Related calculators
- Mean, median and mode calculator for averages
- Z-score calculator for standard deviations from the mean
- Percentage calculator for coefficient of variation style percentages
- Grade calculator and weighted grade calculator
- Printable worksheets for practice
- All calculators
Sources and further reading
- Standard deviation (Wikipedia)
- Bessel’s correction (Wikipedia)
- NIST/SEMATECH e-Handbook of Statistical Methods: measures of scale
Last updated: October 2026.