This free coin flip tool flips 1 to 100 coins at once and shows how many came up heads and tails, the percentage of each, and the longest streak in a row. A fair coin lands heads or tails with exactly the same chance, 50%, and every flip is independent of the ones before it.
Use the coin flip to settle a decision, pick who starts a game, or run a probability experiment in class. Press the button to flip a coin, or set a different number of coins and watch the counts. The history keeps your last 10 flips, and every result is generated by your browser’s secure random generator.
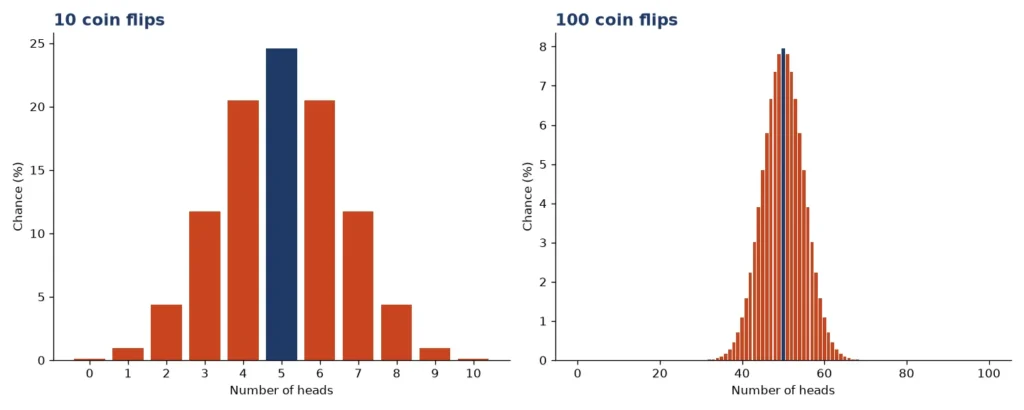
Quick answer: A fair coin flip is 50% heads and 50% tails. For n flips, the chance of exactly k heads is C(n, k) ÷ 2n, so 10 flips give exactly 5 heads 252 ÷ 1,024 = 24.61% of the time. The chance of 5 heads in a row is (1/2)5 = 3.125%, and the next flip is still 50/50.
How to use this coin flip
- Type how many coins to flip (1 to 100), or tap a quick button such as 1, 10 or 100.
- Leave the chance of heads at 50% for a fair coin. Change it only if you want to see how a loaded coin behaves.
- Press Flip the coin. A single flip shows Heads or Tails in large type.
- For several coins, read the count of heads and tails, the percentages and the longest streak. The sequence shows each flip in order (H for heads in bold, T for tails).
- Check the history table for your last 10 flips, and use Copy result to share one.
| Result | What it shows |
|---|---|
| Heads and tails | The count and the percentage of each side |
| Longest streak | The longest run of the same side, for example 4 heads in a row |
| Chance of exactly this split | The binomial probability of the exact number of heads you got |
| All flips on this page | The running total of heads across every flip since you opened the page |
| History | A table of your last 10 flips with heads, tails and streak |
How the coin flip works
The coin flip asks your browser for a random 32-bit number and keeps it only if it falls in a range that splits evenly into a million equal values. Heads is any value below 500,000 and tails is the rest. Throwing away the leftover range is called rejection sampling, and it makes sure neither side is favored by even a hair.
Each flip is a Bernoulli trial: two outcomes, a fixed chance p of heads, and no memory. With n flips, the number of heads follows the binomial distribution.
- Chance of exactly k heads: C(n, k) × pk × (1 − p)n−k. For a fair coin this is C(n, k) ÷ 2n.
- Expected heads: n × p, which is n ÷ 2 for a fair coin.
- Standard deviation of the heads count: √(n × p × (1 − p)), which is √n ÷ 2 for a fair coin.
Worked example 1: exactly 6 heads in 10 flips
There are 210 = 1,024 equally likely sequences of 10 flips. The number with exactly 6 heads is C(10, 6) = 210. So the chance is 210 ÷ 1,024 = 20.51%. The chance of exactly 5 heads is higher, 252 ÷ 1,024 = 24.61%, because 5 is the average.
Worked example 2: five heads in a row
The chance that the first five flips are all heads is (1/2)5 = 1 ÷ 32 = 3.125%. Asking “five heads in a row somewhere in 100 flips” is a different question with a much bigger answer: 97.17% of 100-flip sequences contain a run of at least 5 identical results, as the streak table below shows.
Flip a coin to decide: heads or tails
When you need to flip a coin to decide, assign each option to a side before you flip, and then respect the result. A coin toss gives both sides even odds, takes seconds and ends the argument without anyone feeling cheated. It is used at the start of sports matches, to choose who goes first in a game, and to break ties.
A well-known trick is to notice your own reaction. If you feel disappointed when the coin shows tails, you already knew you wanted heads. For a choice among three or four options, flip twice: two flips give four equally likely outcomes (HH, HT, TH, TT). For a long list of names, use the random name picker.
Heads or tails: does the call matter?
Not for a fair coin. Whether you call heads or tails, your chance of being right is 50%. In practice, tests of real coins found a tiny bias in how coins land, which is covered below, but it is far too small to change a decision.
Coin flip probability for any number of flips
Coin flip probability grows more specific as you add flips. This table gives the most asked questions for 1 to 10 fair coins. The chance of all heads halves with each coin, and the chance of at least one head climbs toward 100%.
| Coins | Possible sequences | All heads | At least one head | Exactly half heads |
|---|---|---|---|---|
| 1 | 2 | 50% | 50% | not possible |
| 2 | 4 | 25% | 75% | 50% |
| 3 | 8 | 12.5% | 87.5% | not possible |
| 4 | 16 | 6.25% | 93.75% | 37.5% |
| 5 | 32 | 3.12% | 96.88% | not possible |
| 6 | 64 | 1.56% | 98.44% | 31.25% |
| 7 | 128 | 0.78% | 99.22% | not possible |
| 8 | 256 | 0.39% | 99.61% | 27.34% |
| 9 | 512 | 0.2% | 99.8% | not possible |
| 10 | 1024 | 0.1% | 99.9% | 24.61% |
All the outcomes of 10 coin flips
| Heads | Ways (out of 1,024) | Chance | This many or more |
|---|---|---|---|
| 0 | 1 | 0.1% | 100% |
| 1 | 10 | 0.98% | 99.9% |
| 2 | 45 | 4.39% | 98.93% |
| 3 | 120 | 11.72% | 94.53% |
| 4 | 210 | 20.51% | 82.81% |
| 5 | 252 | 24.61% | 62.3% |
| 6 | 210 | 20.51% | 37.7% |
| 7 | 120 | 11.72% | 17.19% |
| 8 | 45 | 4.39% | 5.47% |
| 9 | 10 | 0.98% | 1.07% |
| 10 | 1 | 0.1% | 0.1% |
The chance of 7 or more heads in 10 flips is 17.19%, so a result such as 7 heads and 3 tails happens more than once in six tries, and it is no sign that anything is wrong with the coin.
How close to 50% do the results get?
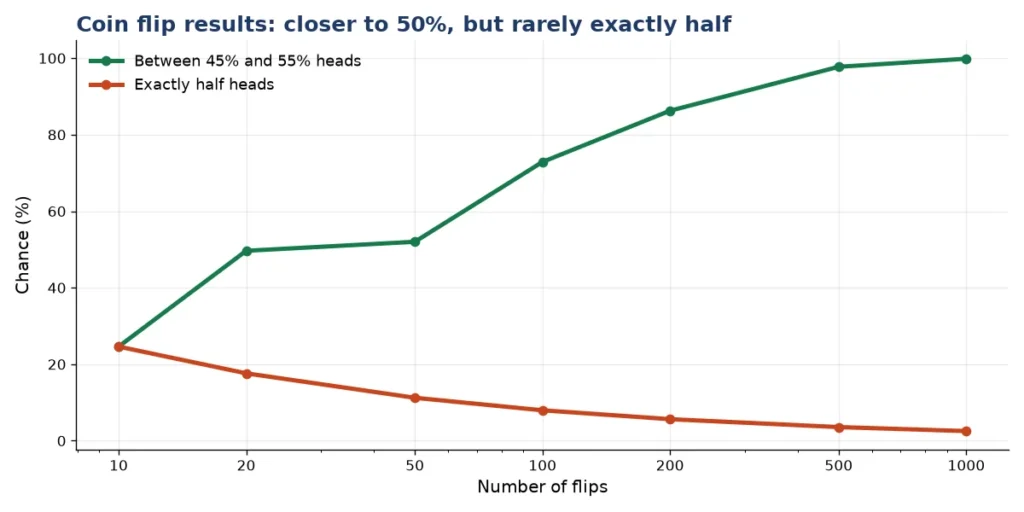
With more flips the share of heads settles near 50%, but the exact count does not get easier to hit. The first column shows how likely it is to land between 45% and 55% heads, the second the chance of exactly half, and the last the usual size of the miss.
| Flips | Between 45% and 55% heads | Exactly half | Typical gap between heads and tails | Spread of the heads share (one standard deviation) |
|---|---|---|---|---|
| 10 | 24.61% | 24.61% | 2.5 | 15.8% |
| 20 | 49.66% | 17.62% | 3.5 | 11.2% |
| 50 | 52.01% | 11.23% | 5.6 | 7.1% |
| 100 | 72.87% | 7.96% | 8.0 | 5.0% |
| 500 | 97.75% | 3.57% | 17.8 | 2.2% |
| 1000 | 99.86% | 2.52% | 25.2 | 1.6% |
Coin flip streaks: how long a run to expect
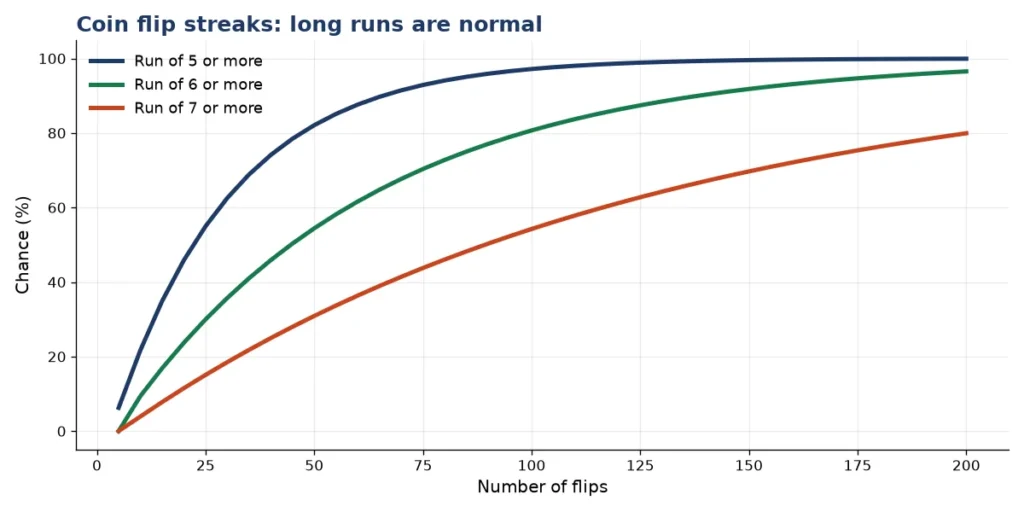
Coin flip streaks surprise people. Runs that look suspicious are normal in real random data. In 20 flips there is a 45.84% chance of a run of at least 5 heads or 5 tails, and in 100 flips there is a 54.23% chance of a run of at least 7. The table is computed exactly by counting every sequence.
| Flips | Run of 4 or more | 5 or more | 6 or more | 7 or more | 8 or more | 10 or more |
|---|---|---|---|---|---|---|
| 10 | 46.48% | 21.68% | 9.38% | 3.91% | 1.56% | 0.2% |
| 20 | 76.84% | 45.84% | 23.69% | 11.51% | 5.44% | 1.17% |
| 50 | 98.12% | 82.09% | 54.41% | 30.89% | 16.2% | 4.05% |
| 100 | 99.97% | 97.17% | 80.68% | 54.23% | 31.48% | 8.67% |
| 200 | >99.99% | 99.93% | 96.53% | 79.93% | 54.19% | 17.24% |
| 500 | 100% | >99.99% | 99.98% | 98.31% | 86.31% | 38.43% |
| 1000 | 100% | >99.99% | >99.99% | 99.97% | 98.17% | 62.39% |
A handy rule: in n fair flips, the longest run is usually near log2(n). For 100 flips that is about 6 or 7, and for 1,000 flips about 10. If someone writes 100 “random” flips by hand and has no run longer than 4, that is a sign the sequence is invented, because real sequences have long streaks.
Is a coin toss really a fair coin 50/50?
A fair coin is one where heads and tails are equally likely, 50/50. The idea is a model, and real coins are very close to it. The model rests on symmetry: nothing about the flip favors one face, so each has probability 1/2, and the two probabilities must add to 1.
Published research on real coin tosses
A research team collected 350,757 real coin flips from many different people and released the results in 2023. The coins landed on the same side they started on 50.8% of the time, which confirms a prediction by Persi Diaconis and colleagues of about 51%. The heads share was 50.0%, with a 95% interval of 49.8% to 50.2%. In other words, which side faces up at the start matters a tiny bit, while heads versus tails does not. The study is on arXiv.
The Wikipedia article on coin flipping adds that a coin can land on its edge. A computational model puts the chance at about 1 in 6,000 for an American nickel, and Diaconis summarized that coin tossing is fair to two decimals but not to three. For decisions and games, that makes a flip as fair as it needs to be.
| Claim | What the evidence says |
|---|---|
| Heads is more likely than tails | No: 50.0% heads in 350,757 flips |
| A coin tends to land as it started | Yes, slightly: about 50.8% |
| A coin can land on its edge | Yes, rarely: about 1 in 6,000 for a US nickel in one model |
| A flipped coin remembers the last flip | No: each flip is independent |
| A tool can flip a fair coin | Yes: this one uses unbiased random bits |
This tool does not need to deal with the physics of spinning metal. It generates the outcome directly, so with the chance of heads at 50% its result is exactly fair, not 50.8% biased.
The gambler’s fallacy: why five heads do not make tails due
The gambler’s fallacy is the belief that a streak must end soon, so after five heads tails is “due”. It is wrong because coins have no memory: the next flip is 50% heads whatever happened before. The best-known example is the roulette wheel at the Monte Carlo Casino, which landed on black 26 times in a row in 1913 while many gamblers kept betting on red. You can read more in the gambler’s fallacy article.
| Situation | Chance of heads next | Why |
|---|---|---|
| After 1 head | 50% | Independent flips |
| After 5 heads in a row | 50% | The coin has no memory |
| After 10 heads in a row | 50% | Still independent (but check the coin) |
| Next 5 flips all heads, from now | 3.125% | Five new flips, each 50% |
Why then does the share of heads still settle near 50%? Because of the law of large numbers: later flips do not “correct” earlier ones, they just dilute them. After 100 flips with 60 heads, 1,000 more flips will add about 500 heads, and the share becomes 560 ÷ 1,100 = 50.9%, with no correction needed. This is also why the gap between heads and tails tends to grow, even as the percentage gets closer to 50%.
Uses for a coin flip: games, classes and decisions
- Start of a game: flip to see who goes first, or use heads for one team and tails for the other.
- Probability lessons: have a class flip 10 coins 20 times, record the heads count, and compare with the table above. Averages near 5 and a spread from 2 to 8 show the binomial shape.
- Best of three: flip until one side has two wins. A fair coin gives each side a 50% chance of winning a best-of-three or best-of-five.
- Mixed with dice: use a coin flip to decide an odd or even result, and the dice roller for larger sets of options.
- Odds practice: use the dice probability calculator for the same ideas with dice.
Common mistakes with coin flips
- Choosing the side after the flip. Decide what heads and tails mean first.
- Expecting alternating results. Real flips often repeat. HHTH is as likely as HTHT.
- Reading too much into a short run. 7 heads in 10 flips happens 17.19% of the time.
- Confusing a rare sequence with an unlikely result. Every exact sequence of 10 flips has the same chance, 1 in 1,024, including HHHHHHHHHH and HTHTTHHTHT.
Questions people ask about the coin flip
Coin flip heads or tails: how do I decide between two options?
Say which option is heads and which is tails, press the flip button once, and follow the result. If you notice you wish for the other side, that tells you your real preference.
Is there a coin flip calculator for probabilities?
Yes. The tables on this page act as a coin flip calculator for common cases, and each result shows the exact probability of the number of heads you got. For other chances, the binomial formula C(n, k) ÷ 2n works for any n and k.
Coin flip with more than two outcomes
Use several flips. Two flips cover four options, three flips cover eight, and so on, because n flips give 2n equally likely sequences. For three options, flip twice and repeat if you get the fourth outcome.
Can I flip a coin with a different chance of heads?
Yes. Change the chance of heads from 50% to another value, such as 60%. It lets you see how a loaded coin behaves, and how many flips it takes before the bias shows.
Frequently asked questions
10 quick answers
Is the coin flip really random?
Yes. Each flip uses your browser’s secure random generator, with rejection sampling to avoid bias. The chance of heads is exactly 50% unless you change it.
How many coins can I flip at once?
You can flip 1 to 100 coins in one go. The tool lists every flip in order and counts heads, tails and the longest streak.
What is the probability of flipping heads 5 times in a row?
It is (1/2) to the power 5 = 1 in 32, or 3.125%, for a set of five flips. In 100 flips the chance of a run of at least 5 heads or tails somewhere is 97.17%.
What are the odds of getting exactly 5 heads in 10 flips?
The odds are 252 in 1,024, which is 24.61%. It is the most likely single outcome for 10 flips.
Is a real coin flip 50/50?
It is very close. A study of 350,757 flips found 50.0% heads, with a small 50.8% tendency for coins to land on the side they started.
What is the gambler’s fallacy?
It is the mistaken belief that past flips change the next one. After five heads in a row, the chance of heads is still 50%.
How likely is a coin to land on its edge?
It is rare. One computational model gives about 1 in 6,000 for a US nickel. This tool never lands on an edge.
What is the longest streak I should expect?
In 100 fair flips the longest run is typically 6 or 7. A run of 10 or more happens in only 8.67% of 100-flip sequences.
Why do I get more heads than tails sometimes?
Random flips vary. In 10 flips, getting 6 or more heads happens 37.7% of the time, and the same for tails.
Does the tool remember my flips?
It shows the last 10 flips and a running total while the page is open. Nothing is stored or sent anywhere.
Related calculators
- Dice roller: roll d4 to d100 with a modifier
- Dice probability calculator: exact odds for any dice
- Random name picker: pick winners and make teams
- Random number generator: any range of numbers
- Percentage calculator
- Printable worksheets
Sources and further reading
- Bartoš and colleagues: Fair coins tend to land on the same side they started (arXiv 2023): 350,757 flips, 50.8% same side.
- Coin flipping on Wikipedia: history, physics and the edge-landing estimate.
- Gambler’s fallacy on Wikipedia: the Monte Carlo example and why streaks do not reverse.
- Binomial distribution on Wikipedia: the formula for the number of heads.
Last updated: October 2026.