A z score calculator tells you how many standard deviations a value is above or below the mean: z = (x − μ) ÷ σ. This free z score calculator finds z from x, the mean and the standard deviation, finds x from z, and turns any z into a percentile, a probability and a critical value, with every step of the working shown.
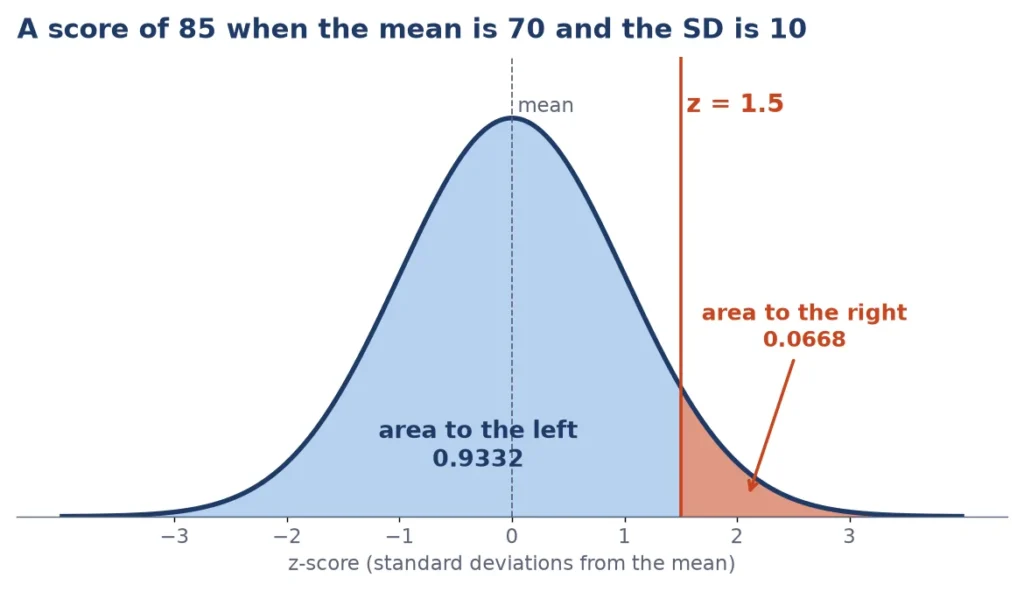
Quick answer: z = (x − μ) ÷ σ. For a score of 85 with a mean of 70 and a standard deviation of 10, z = (85 − 70) ÷ 10 = 1.5. On the standard normal distribution that is the 93.32nd percentile: 0.9332 of scores fall below it and 0.0668 above it.
How to use this z score calculator
The z score calculator has five modes, chosen with the buttons at the top of the box. Type the numbers for your mode and the answer, the percentile and the steps appear straight away.
| Mode | You type | You get |
|---|---|---|
| Find z | raw score x, mean μ, standard deviation σ | z, percentile, area left and right, area between the mean and x, two-tailed area |
| Find x from z | z, mean, standard deviation | the raw score x = μ + zσ and its percentile |
| Find a probability | x (and x₂), mean, standard deviation, and less than, greater than, between or outside | the probability as a decimal and a percent |
| Percentile to z | a percentile such as 90, plus optional mean and standard deviation | z for that percentile and the matching raw score |
| Critical z | a confidence level such as 95 | the two-tailed and one-tailed critical z-values and α |
For the standard normal distribution, set the mean to 0 and the standard deviation to 1; then x and z are the same number. Tap Copy result to paste the answer, or Copy link to share the exact setup.
Z score formula: z = (x − μ) ÷ σ
The z score formula standardizes a value. Subtract the mean from the raw score to see how far it sits from the middle, then divide by the standard deviation to measure that distance in standard deviation units.
z = (x − μ) ÷ σ
Here x is the raw score, μ (mu) is the mean and σ (sigma) is the standard deviation. When you only have a sample, the same calculation uses the sample mean and the sample standard deviation. A positive z means the score is above the mean, a negative z means below, and z = 0 means exactly at the mean.
Find x from z score with x = μ + zσ
To find x from a z score, reverse the formula: x = μ + z × σ. Multiply z by the standard deviation to get the distance from the mean, then add it to the mean. With a mean of 70, a standard deviation of 10 and z = −1.5, x = 70 + (−1.5 × 10) = 55. The Find x from z mode of the calculator does this in one step.
Z score calculator examples with test scores
These worked examples match what the z score calculator shows. Type the same numbers to compare the steps.
Example 1: an exam score of 600
Scores on a test have a mean of 500 and a standard deviation of 100. Your score is 600, so z = (600 − 500) ÷ 100 = 1. The area to the left of z = 1 is 0.8413, so you are at about the 84th percentile, ahead of 84.13% of test takers.
Example 2: a score below the mean
A class test has mean 70 and standard deviation 10. A score of 55 gives z = (55 − 70) ÷ 10 = −1.5. The area to the left is 0.0668, so only 6.68% of students scored lower.
Example 3: comparing two subjects
Maya scored 78 in math (class mean 70, standard deviation 8) and 82 in science (class mean 75, standard deviation 10). In math z = (78 − 70) ÷ 8 = 1.00. In science z = (82 − 75) ÷ 10 = 0.70. The higher z shows she did relatively better in math, even though her science mark is higher.
Example 4: probability between two scores
With mean 70 and standard deviation 10, what share of students score between 60 and 85? The z-scores are −1 and 1.5. The area to the left of 1.5 is 0.9332 and to the left of −1 is 0.1587, so the probability is 0.9332 − 0.1587 = 0.7745, or 77.45%.
Example 5: the cutoff for the top 10%
To find the score that beats 90% of students (mean 70, standard deviation 10), use Percentile to z. The z for the 90th percentile is 1.2816, so x = 70 + 1.2816 × 10 = 82.82.
Each example follows the same three moves: standardize with the z score formula, read the area from the standard normal distribution, then turn the area into a percent or a score. If a step surprises you, open the How it works panel of the z score calculator to see the numbers it used, including the rounded z-table lookup next to the exact value.
Z score to percentile: how to read the result
A z score to percentile conversion uses the cumulative area under the normal curve. The percentile is the share of values at or below your score. If z = 1.5 the area to the left is 0.9332, which is the 93rd percentile. The area to the right is 1 − 0.9332 = 0.0668. The area between the mean and z is 0.9332 − 0.5 = 0.4332.
The calculator also shows the two-tailed area beyond ±|z|, which is what a two-sided p-value uses. For z = 1.5 it is 2 × 0.0668 = 0.1336. For any z-score, probability from z score means reading one of these areas, depending on whether you want less than, greater than, between or outside.
Z score table: standard normal distribution values
A z score table lists the area to the left of z under the standard normal distribution, which has a mean of 0 and a standard deviation of 1. The table below is computed with the same accurate normal function the calculator uses, so you can look up common values without opening a printed table.
| z | Area to the left | Area to the right | Percentile | Two-tailed area |
|---|---|---|---|---|
| 0 | 0.5000 | 0.5000 | 50.00% | 100.00% |
| 0.25 | 0.5987 | 0.4013 | 59.87% | 80.26% |
| 0.5 | 0.6915 | 0.3085 | 69.15% | 61.71% |
| 0.75 | 0.7734 | 0.2266 | 77.34% | 45.33% |
| 1 | 0.8413 | 0.1587 | 84.13% | 31.73% |
| 1.25 | 0.8944 | 0.1056 | 89.44% | 21.13% |
| 1.5 | 0.9332 | 0.0668 | 93.32% | 13.36% |
| 1.645 | 0.9500 | 0.0500 | 95.00% | 10.00% |
| 1.75 | 0.9599 | 0.0401 | 95.99% | 8.01% |
| 1.96 | 0.9750 | 0.0250 | 97.50% | 5.00% |
| 2 | 0.9772 | 0.0228 | 97.72% | 4.55% |
| 2.25 | 0.9878 | 0.0122 | 98.78% | 2.44% |
| 2.326 | 0.9900 | 0.0100 | 99.00% | 2.00% |
| 2.5 | 0.9938 | 0.0062 | 99.38% | 1.24% |
| 2.576 | 0.9950 | 0.0050 | 99.50% | 1.00% |
| 3 | 0.9987 | 0.0013 | 99.87% | 0.27% |
For negative z-scores use symmetry: the area to the left of −z equals the area to the right of z. The area to the left of −1.5 is 0.0668.
How unusual is a z-score?
| |z| is | Reading | Share of values within ±|z| |
|---|---|---|
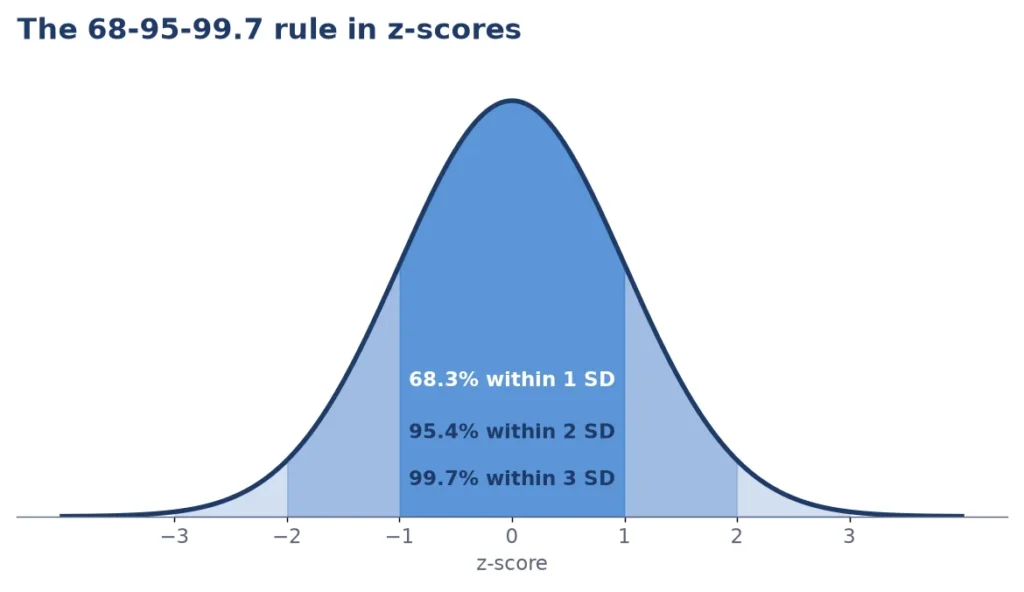
| below 1 | typical, close to the mean | up to 68.27% |
| 1 to 2 | somewhat above or below average | 68.27% to 95.45% |
| 2 to 3 | unusual: outside the middle 95% | 95.45% to 99.73% |
| above 3 | very unusual, often flagged as an outlier | over 99.73% |
The common cut-off for a possible outlier is |z| above 3, though some fields use 2.5 or 2. It is a rule of thumb, not a law.
Critical z value for 90, 95 and 99% confidence
A critical z value is the z-score that cuts off the tail area α you are willing to accept. The Critical z mode gives it for any confidence level. Use the two-tailed value for a confidence interval and for a two-sided test, and the one-tailed value for a one-sided test.
| Confidence level | α | Two-tailed z* | One-tailed z* |
|---|---|---|---|
| 80% | 0.2 | ±1.2816 | 0.8416 |
| 90% | 0.1 | ±1.6449 | 1.2816 |
| 95% | 0.05 | ±1.96 | 1.6449 |
| 98% | 0.02 | ±2.3263 | 2.0537 |
| 99% | 0.01 | ±2.5758 | 2.3263 |
| 99.9% | 0.001 | ±3.2905 | 3.0902 |
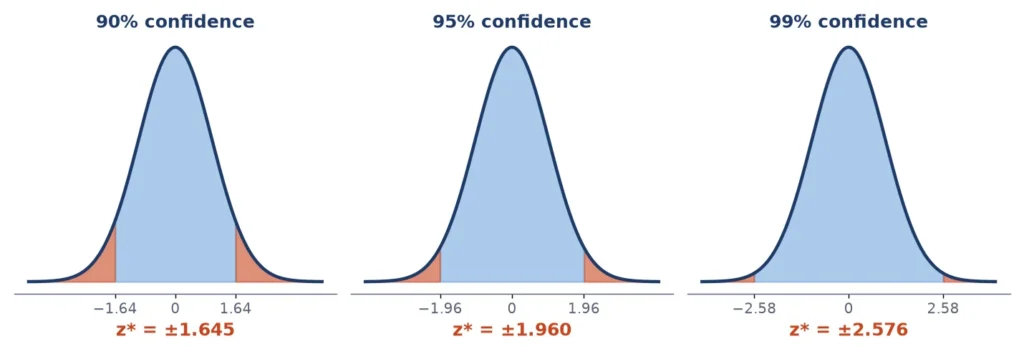
For a 95% confidence interval for a mean with a known standard deviation, the margin of error is 1.96 × σ ÷ √n. For a two-sided test at α = 0.05, reject the null hypothesis when |z| is above 1.96, which matches a two-tailed p-value below 0.05. At z = 2.1 the two-tailed p-value is 0.0357. Use a t-distribution instead of z when the population standard deviation is unknown and the sample is small.
Z score calculator from mean and standard deviation
To use the z score calculator from a mean and standard deviation, choose Find z, type x, the mean and the standard deviation. The standard deviation must be above zero. If you only have a list of numbers, find the mean and standard deviation first with the standard deviation calculator or the mean, median and mode calculator, then enter them here.
Z score calculator given percentile or area
To work backwards from a percentile or an area, use the Percentile to z mode. Type 95 for the 95th percentile and you get z = 1.6449. This is the same as looking inside a z-table for the area and reading the row and column headings.
When a z-score works and when it does not
- It assumes a roughly normal bell curve. For very skewed data, such as incomes, a percentile from the z-table can be misleading.
- Use the right mean and standard deviation. Mix a population mean with a sample standard deviation and the result is only approximate.
- It is not a medical tool. Growth-chart and bone-density z-scores use special reference data, so ask a clinician for those.
- A z-score compares, it does not grade. A z of 0 is an average result, not a failing one.
Z-scores are used in school testing, quality control, finance and research. IQ tests, for example, are commonly scaled to a mean of 100 and a standard deviation of 15, so an IQ of 130 has z = 2 and sits at the 98th percentile.
Common mistakes with z-scores
- Dividing by the variance. Divide by the standard deviation, which is the square root of the variance.
- Mixing up left and right areas. A z-table gives the area to the left; subtract it from 1 for the area to the right.
- Forgetting the two tails. A two-sided p-value doubles the one-tail area: 2 × 0.0668 = 0.1336 for z = 1.5.
- Rounding z too early. Keep at least three decimals until the final percentile, since z = 1.96 and z = 2 differ by about 0.0023 in area.
- Using it on very small samples. With a small sample and an unknown population standard deviation, use a t-test instead.
Z score for a sample mean
When you test an average instead of a single value, divide by the standard error. The formula is z = (x̄ − μ) ÷ (σ ÷ √n), where x̄ is the sample mean, μ the population mean, σ the population standard deviation and n the sample size. Suppose a school district knows its test mean is 70 with a standard deviation of 12, and a sample of 36 students averages 74.
The standard error is 12 ÷ √36 = 2, so z = (74 − 70) ÷ 2 = 2. The z score calculator gives an area to the left of 0.9772 and a two-tailed p-value of 0.0455. Enter 2 as x, 0 as the mean and 1 as the standard deviation in Find a probability to see the same areas.
Z score, T-score and IQ: comparing scales
Many reports rescale the z-score so nobody has to read negative numbers. A T-score has a mean of 50 and a standard deviation of 10, and Wechsler IQ scores use a mean of 100 and a standard deviation of 15. The conversions are simple: T = 50 + 10z and IQ = 100 + 15z.
| z-score | T-score (mean 50, SD 10) | IQ-style score (mean 100, SD 15) | Percentile |
|---|---|---|---|
| −2 | 30 | 70 | 2.3% |
| −1 | 40 | 85 | 15.9% |
| 0 | 50 | 100 | 50.0% |
| 1 | 60 | 115 | 84.1% |
| 1.5 | 65 | 122 | 93.3% |
| 2 | 70 | 130 | 97.7% |
| 3 | 80 | 145 | 99.9% |
The same idea sits behind other standard scores, so the table is a handy check. Each row represents the same position on the bell curve; only the labels change.
Z scores in the United States, Canada, the UK and Australia
Z-scores are taught the same way in every country, usually in a statistics course in high school or college. Textbooks in the UK, Australia and New Zealand often call the result a standard score and use a normal distribution table that lists the area between 0 and z, so check which area your table gives. The z score calculator shows the area to the left, to the right and between the mean and z, so it matches either style.
Frequently asked questions
10 quick answers
What is a z-score?
A z-score is the number of standard deviations a value is from the mean. It is calculated as z = (x − μ) ÷ σ, and it lets you compare values from different scales.
How do I calculate a z-score?
Subtract the mean from your value and divide by the standard deviation. For x = 85, mean 70 and standard deviation 10, z = 15 ÷ 10 = 1.5.
How do I find x from a z-score?
Use x = μ + z × σ. With a mean of 70, a standard deviation of 10 and z = 2, x = 70 + 20 = 90.
How do I turn a z-score into a percentile?
Look up the area to the left of z under the standard normal curve. A z of 1 is about the 84th percentile (84.13%), and a z of 1.96 is the 97.5th.
What is a good z-score?
It depends on the goal. A high positive z means a score well above average, while a z near 0 is typical. For quality control, values with |z| above 3 are often treated as outliers.
Can a z-score be negative?
Yes. A negative z-score means the value is below the mean, and the area to its left is under 0.5.
What is the critical z value for 95% confidence?
The two-tailed critical z value for 95% confidence is ±1.96. For a one-tailed 95% test it is 1.645.
What z-score is the 90th percentile?
The 90th percentile has z = 1.2816. About 90% of values in a normal distribution fall below that point.
What is the difference between a z-score and a t-score?
A z statistic uses the known population standard deviation, while a t statistic uses the sample standard deviation and the t-distribution, which has heavier tails for small samples. (This is different from the T-score scale described above, where T = 50 + 10z.)
What mean and standard deviation does the standard normal distribution have?
The standard normal distribution has a mean of 0 and a standard deviation of 1, so a raw score on it already equals its z-score.
Related calculators and worksheets
- Standard deviation calculator to get the mean and spread of a data set
- Mean, median and mode calculator and percentage calculator
- Dice probability calculator and permutation and combination calculator
- Weighted grade calculator and grade calculator for course marks
- Probability worksheets for classroom practice
- All calculators
Sources and further reading
- Standard score (Wikipedia): the z-score definition and formula
- Normal distribution (Wikipedia): the standard normal distribution and the 68-95-99.7 rule
- Standard normal table (Wikipedia): how to read a z-table
- NIST e-Handbook of Statistical Methods: normal distribution: a U.S. government reference on the normal distribution
Last updated: October 2026.