Tally charts and picture graphs are two of the first ways that children collect and show data. A tally chart records each answer with a mark as it is counted, and a picture graph shows the totals with symbols and a key. The six PDFs on this page turn tallies into bar graphs and read scaled picture graphs, and every sheet has an answer key. They follow standards 1.MD.C.4, 2.MD.D.10 and 3.MD.B.3 of the Common Core standards for grade 2 measurement and data.
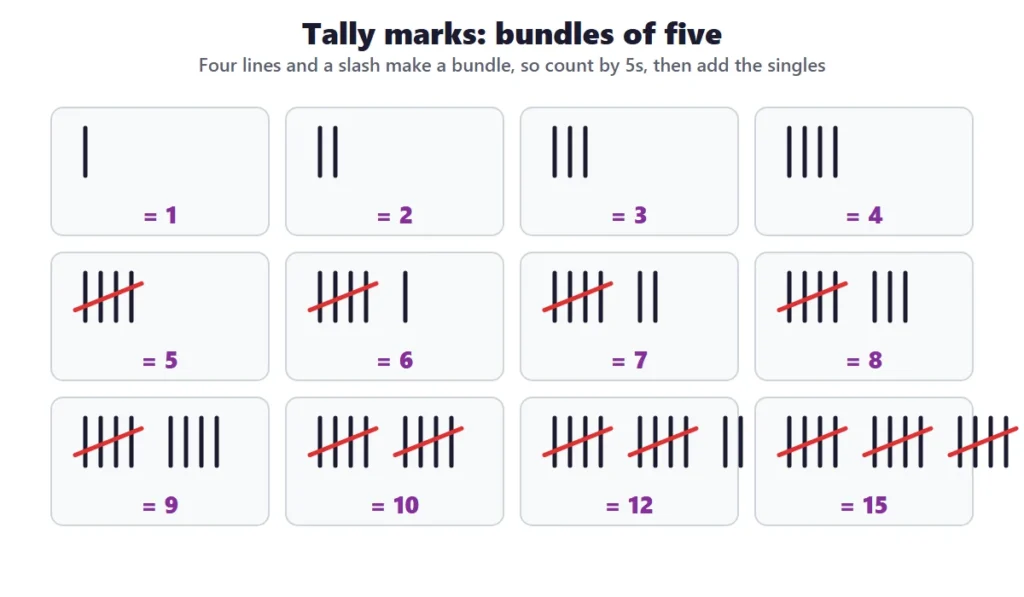
Tally marks. Bundles of five.
What is on this page
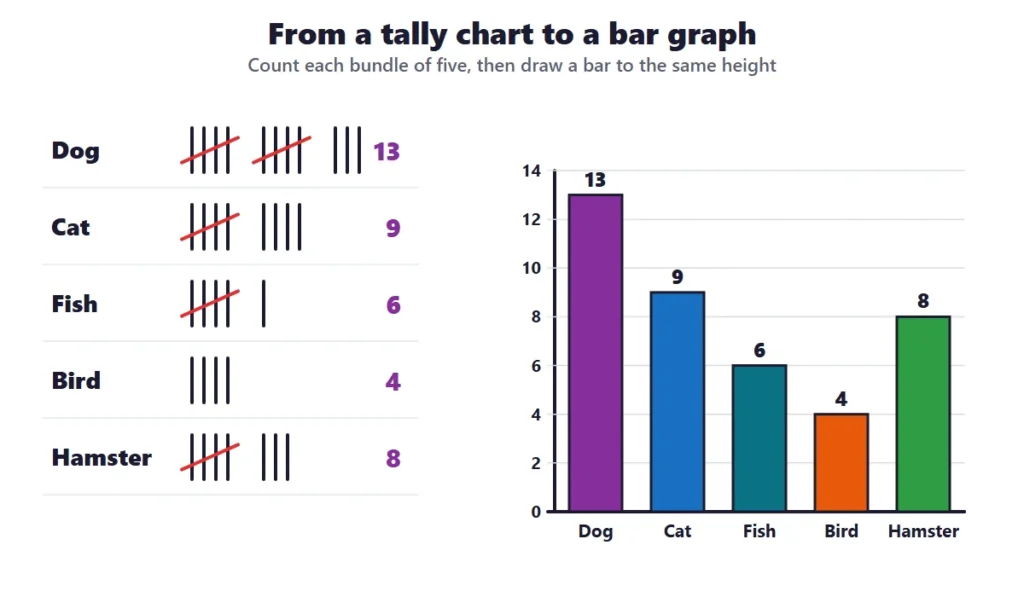
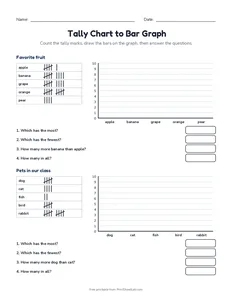
Tally chart to bar graph: count the tally marks, then color the bars to match.
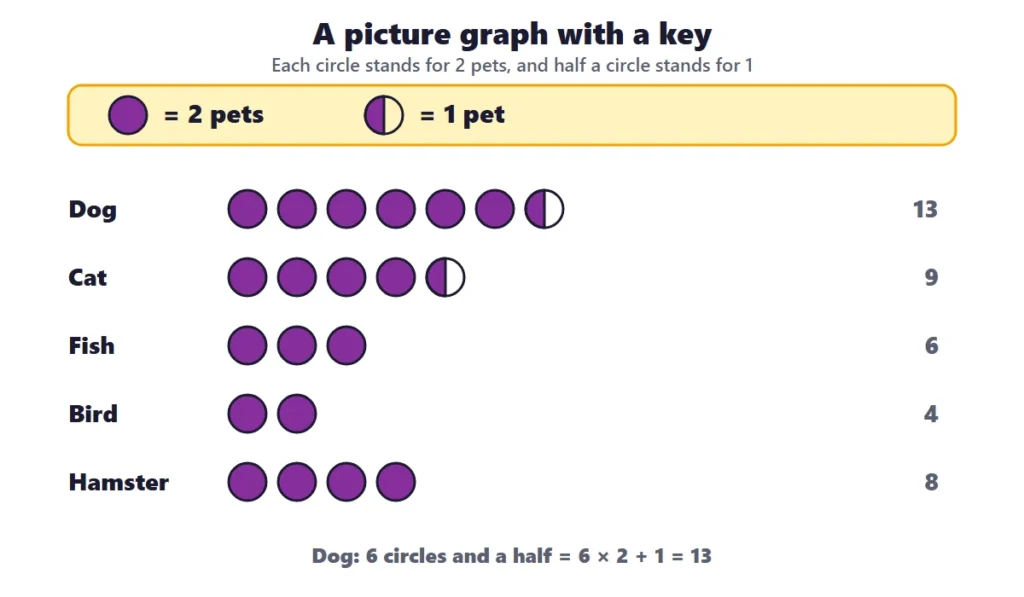
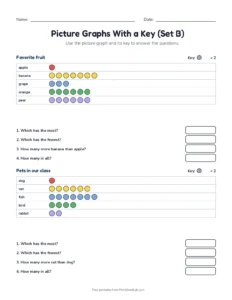
Picture graphs with a key: each circle stands for 2, so children count by 2s.
Every graph comes with questions: the most, the fewest, how many more and how many in all.
Tally charts and picture graphs worksheets: what is in the set
There are 6 tally charts and picture graphs worksheets on this page, and every one has an answer key except for any cut-out games. Four sets turn tally charts into bar graphs, and two sets read picture graphs where each circle stands for 2.
Worksheet
What children do
Standard
Tally Chart to Bar Graph
Count the tallies and draw the bars for two data sets.
2.MD.D.10
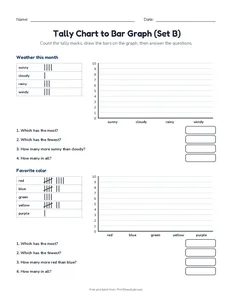
Tally Chart to Bar Graph (Set B)
Two more data sets to graph.
2.MD.D.10
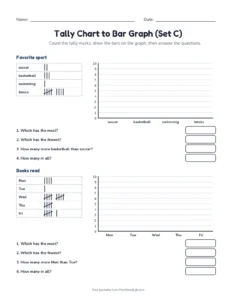
Tally Chart to Bar Graph (Set C)
Favorite sport and books read: count and graph.
2.MD.D.10
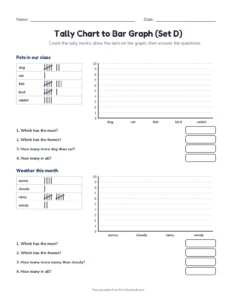
Tally Chart to Bar Graph (Set D)
Pets and weather: count the tallies and draw the bars.
2.MD.D.10
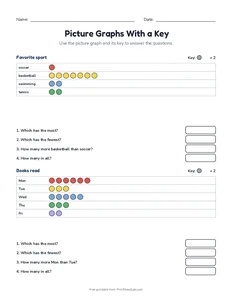
Picture Graphs With a Key
Read picture graphs where each circle stands for 2.
2.MD.D.10
Picture Graphs With a Key (Set B)
More picture graphs where each circle stands for 2.
2.MD.D.10
Tally charts and picture graphs: how tally marks work
Tally charts and picture graphs both start with counting, and the tally mark is the quickest way to count as the answers come in. Each answer is a short vertical line, and every fifth line is drawn across the four before it, so the marks make bundles of five. Wikipedia’s article on tally marks shows that people have counted this way for thousands of years. The bundles let children count by 5s and then add the singles. This table shows ten counts and how to read them:
Count
Bundles of five
Single strokes
Counting it: by 5s, then by 1s
3
0
3
1, 2, 3
5
1
0
5
8
1
3
5, 6, 7, 8
10
2
0
5, 10
13
2
3
5, 10, 11, 12, 13
17
3
2
5, 10, 15, 16, 17
20
4
0
5, 10, 15, 20
23
4
3
5, 10, 15, 20, 21, 22, 23
27
5
2
5, 10, 15, 20, 25, 26, 27
30
6
0
5, 10, 15, 20, 25, 30
A child who sees 4 bundles and 3 singles counts 5, 10, 15, 20, 21, 22, 23. The skip counting worksheets page practices the counting by 5s that this needs.
Tally chart worksheets: from a tally chart to a bar graph
The tally chart worksheets give a table with a tally for each category, and children count the tallies and draw the bars. For the pet survey in the diagram above, each tally is turned into a number and then into the height of a bar. This table shows the five pets, with the count, the bundles and the height of the bar when each square is worth 2:
Pet
Tally count
Bundles and singles
Bar height (each square is 2)
Circles in a picture graph (each circle is 2)
Dog
13
2 bundles and 3
6.5
6 and a half
Cat
9
1 bundle and 4
4.5
4 and a half
Fish
6
1 bundle and 1
3
3
Bird
4
0 bundles and 4
2
2
Hamster
8
1 bundle and 3
4
4
The five counts add up to 40, which is the number of children who answered. A check that the total is right is a good habit before drawing: if the bars add up to a different number, a tally has been counted wrongly. The bar graphs page has more about reading the bars once they are drawn.
Picture graph worksheets: reading a key
The picture graph worksheets use a symbol for a number of items, and a key says how many. When each circle is worth 2, 6 circles show 12 items, and half a circle shows 1 more. Wikipedia’s article on pictograms shows how picture symbols have been used to show information for a very long time. This table shows what the key means for three different scales:
Key: each symbol is
Number of items
Full symbols
Half symbol
Check
2
6
3
none
3 × 2 = 6
2
7
3
half
3 × 2 = 7
2
10
5
none
5 × 2 = 10
2
13
6
half
6 × 2 = 13
5
10
2
none
2 × 5 = 10
5
15
3
none
3 × 5 = 15
5
25
5
none
5 × 5 = 25
5
35
7
none
7 × 5 = 35
10
30
3
none
3 × 10 = 30
10
70
7
none
7 × 10 = 70
The rule is always the same: count the symbols and multiply by the key. When there is a half symbol, add half the key. A key of 5 cannot show a value such as 12 exactly, so a set of data is always chosen to fit the key.
Pictograph worksheets: questions to ask
The pictograph worksheets come with the same questions every time, so children learn what to look for: the most, the fewest, how many more, how many fewer and how many in all. This table shows seven questions for the pet survey:
Question
How to find it
Answer
Which pet is the most popular?
the longest row
Dog, with 13
Which pet is the least popular?
the shortest row
Bird, with 4
How many more dogs than cats?
13 − 9
4
How many fewer birds than fish?
6 − 4
2
How many dogs and cats together?
13 + 9
22
How many pets in all?
13 + 9 + 6 + 4 + 8
40
Which two pets together make 17?
9 + 8
Cat and hamster
It is useful to ask children to say the answer as a sentence: “Dogs are the most popular pets, with 13 votes.” This connects the number to the picture and to the question.
Tally marks worksheet: counting by 5s
A tally marks worksheet is a good way to practice counting by 5s, since every bundle is 5. Children who can count by 2s, 5s and 10s read every kind of graph with more ease. This table shows the three counts that are used with graphs:
Tally to bar graph. Count the bundles, then draw the bars.
Count by
The first ten numbers
Used for
2
2, 4, 6, 8, 10, 12, 14, 16, 18, 20
picture graphs with a key of 2
5
5, 10, 15, 20, 25, 30, 35, 40, 45, 50
bundles of tally marks, and a key of 5
10
10, 20, 30, 40, 50, 60, 70, 80, 90, 100
picture graphs of large numbers
Tallies, keys of 2 and keys of 5 all use skip counting, so a few minutes a day of skip counting helps with all the graphs on this page.
Graphing grade 2: which display to use
For graphing grade 2, children learn to organize data in a table, show it in a graph and ask questions about it. The three displays used on this page have different jobs, and it helps to say what each one is best for. This table compares them:
Display
Used to
Example
Made of
Tally chart
collect the answers one at a time
counting votes while a survey goes on
tally marks and counts
Picture graph
show small totals with a key
pets, fruit or books
symbols and a key
Bar graph
compare totals, and large totals
sports chosen by a whole school
bars and a scale
A tally chart is for collecting, a picture graph is for showing small totals, and a bar graph is for comparing. A good project is to collect data with a tally chart, then show it twice, in a picture graph and in a bar graph. Which one is easier to read? The math word problems worksheets use the same graphs in word problems.
Common mistakes with tally charts and picture graphs
Most mistakes come from not knowing what a bundle or a key stands for. This table shows five mistakes, what went wrong and the fix:
What the child says
What went wrong
The fix
Counts every tally stroke as 1, including the slash
does not know the slash closes a bundle of five
four lines and a slash make 5, so count by 5s
Reads a picture graph by counting the pictures
forgets the key
multiply the number of symbols by the value of the key
Ignores the half symbol
sees only the full pictures
a half symbol is worth half of the key
Draws tally marks in a straight line of ten
does not make bundles
group in fives, so they are easy to count
A graph with a key of 2 has 6 circles, so the total is 6
does not use the key
6 circles × 2 = 12
Tally charts and picture graphs word problems
Tally charts and picture graphs show up in surveys and votes. Ask children to say what each tally or symbol stands for before they calculate:
Word problem
Working
Answer
A tally chart shows 4 bundles of five and 3 singles. How many is that?
4 × 5 + 3
23
In a picture graph each circle stands for 2. There are 6 circles and a half circle. How many is that?
6 × 2 + 1
13
Dogs have 13 votes and cats have 9. How many more votes do dogs have?
13 − 9
4 more
A tally chart has 8 votes for fish and 6 votes for birds. How many votes in all?
8 + 6
14 votes
A key says each symbol is 5 books. There are 7 symbols. How many books?
7 × 5
35 books
Class 2A votes: red 7, blue 5, green 3. How many children voted?
7 + 5 + 3
15 children
Games and activities for tally charts and picture graphs
Children learn tally charts and picture graphs best when they play with it. These games use things that are found at home or in a classroom:
Class vote: take a vote on a question, record it with tally marks and show the result in a graph
Tally dice: roll two dice 25 times, tally the totals and make a graph
Draw the key: make a picture graph of the books read this week, with a key you choose
Tally walk: tally the cars, trees and birds seen on a short walk
Pet survey: ask friends and family which pet they like best, and graph the answers
Find the error: give a picture graph with a wrong count and ask children to find it
Extra support and extra challenge with tally charts and picture graphs
For children who need more support: start with tally marks and count them by 5s with a finger. Make bundles of five from craft sticks, and then draw the bundles. Use a key of 1 first, then a key of 2. Practice only the first tally chart set, and use the answer key for every check.
For children who need more challenge: ask for a key of 5 or 10, for a graph of their own data with a title and labels, and for a question with two steps, such as how many more dogs and cats together than fish and birds together. The picture graph with a key of 2 is a good challenge.
How to tell that a child is ready to move on from tally charts and picture graphs
The child makes tally marks in bundles of five and counts them by 5s.
The child turns a tally chart into a bar graph.
The child reads a picture graph using the key, including half symbols.
The child answers how many more and how many in all.
A 20-minute lesson on tally charts and picture graphs
A short lesson is the best way to introduce tally charts and picture graphs. This 20-minute plan can be used in a classroom, at a tutoring session or at home, and it uses the worksheets at the end:
Picture graph. Each circle is 2 pets.
Minutes
Activity
What to say or ask
0 to 3
Take a quick class vote and make tally marks on the board
What happens at five?
3 to 8
Count the tallies together by 5s and 1s
How many bundles? How many singles?
8 to 13
Turn the tallies into a bar graph, one bar for each category
How tall is each bar?
13 to 18
Show the same data in a picture graph with a key of 2
How many circles for 7?
18 to 20
Start a worksheet and check one answer
Check the key.
Where tally charts and picture graphs fits across the grades
No skill stands alone. This table shows what children learn before and after tally charts and picture graphs, with the standard that goes with each step:
Grade
What children do
Standard or page
Grade 1
Organize and read data with up to three categories
This page is the first graphing page. The whole sequence is on the graphing worksheets page.
Helping at home with tally charts and picture graphs
Parents do not need to be experts to help with tally charts and picture graphs. These suggestions work well, and each takes only a few minutes:
Keep a tally of the cars of each color on a walk.
Make a tally chart of the family’s favorite pizza toppings.
Ask “how many more?” and “how many in all?” about the chart.
Draw a picture graph with stickers and a key.
Check the answers with the answer key and ask the child to read the key aloud.
How to check progress in tally charts and picture graphs
A teacher or parent can check progress with the answer key and a few questions. This table shows three common situations, what they mean and what to do next:
What you see
What it means
What to do next
The child counts every tally mark as 1
The bundle of five is not yet a unit
Count with the bundles: 5, 10, 15, and then the singles
The child gets 9 of 10 right in every set
The skill is secure
Move on to bar graphs with a scale
The child ignores the key in a picture graph
The child counts the pictures only
Underline the key, and write “× 2” beside each row
A five-day plan for tally charts and picture graphs
Most children need about a week of short sessions for tally charts and picture graphs. This plan follows the order of the worksheets on this page:
Day
What to do
Practice
Day 1
Make tally marks for a class survey and count them by 5s
Count the pictures and multiply by the key. Five circles when each circle = 2 means 10.
What questions can a graph answer?
Which is the most or least, how many there are of each, how many more one has than another, and the total.
How do you read a tally chart?
Count each bundle of five tally marks as 5, and then count the single marks. Four bundles and three singles make 5, 10, 15, 20, 21, 22, 23, so the count is 23.
How do you read a picture graph with a key?
Count the symbols in a row and multiply by the value in the key. If each circle stands for 2 and there are 5 circles, the total is 10. A half circle stands for half of the key.
What is the difference between tally charts and picture graphs?
A tally chart records counts with marks as the data comes in, and a picture graph shows totals with symbols and a key. Many classes start with a tally chart and then turn it into a picture graph or a bar graph.