Bar graphs use bars of different heights to show how much there is in each group, so children can compare amounts at a glance. The five PDFs on this page ask children to read bar graphs, compare the bars and answer questions about them, with scales that count by 1s, 2s and 5s, and every sheet has an answer key. They follow standards 2.MD.D.10 and 3.MD.B.3 of the Common Core standards for grade 2 measurement and data, and the notes below show how to teach each step.
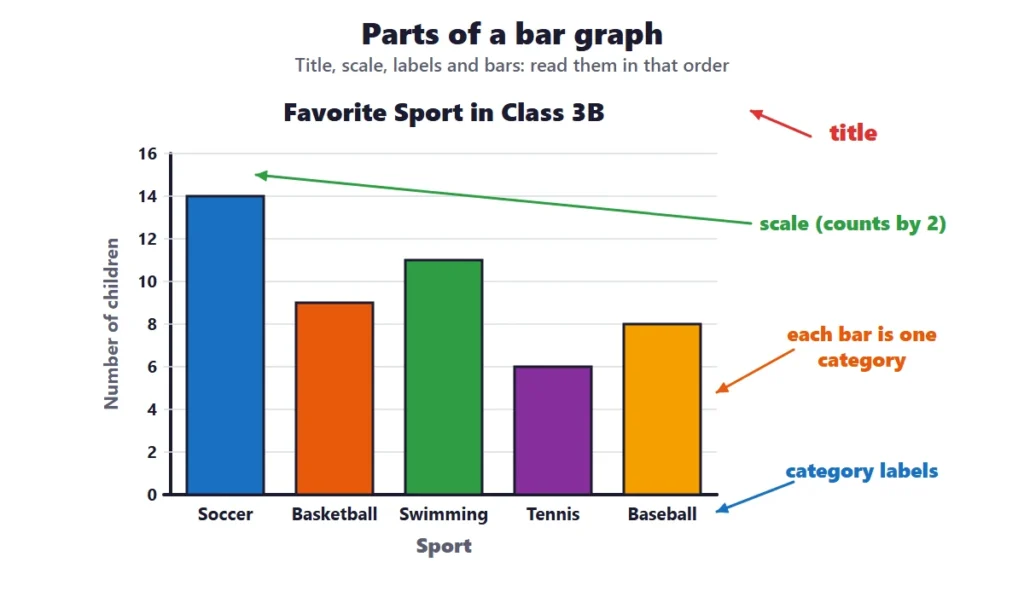
Parts of a bar graph. Title, scale, bars and labels.
Reading a bar graph
Run your finger from the top of a bar straight across to the scale to read its value. To find “how many more”, read both bars and subtract. Some of these graphs count by 2s, so children must read the scale carefully rather than count the grid lines.
Bar graphs worksheets: what is in the set
There are 5 bar graphs worksheets on this page, and every one has an answer key except for any cut-out games. Two sets use a scale that counts by 2s, one set uses a scale of 5s, and the others mix questions about the most, the fewest and how many more.
Worksheet
What children do
Standard
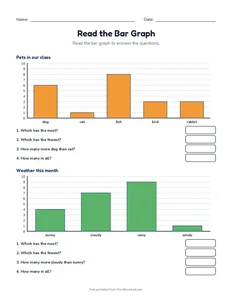
Read the Bar Graph
Answer questions about two bar graphs.
2.MD.D.10
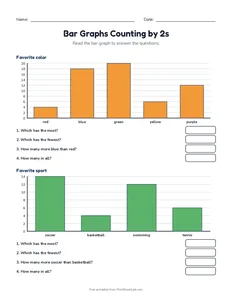
Bar Graphs Counting by 2s
Bar graphs with a scale in 2s.
2.MD.D.10
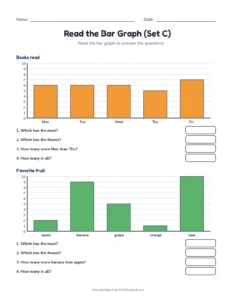
Read the Bar Graph (Set C)
Two more bar graphs with questions.
2.MD.D.10
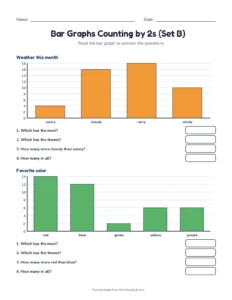
Bar Graphs Counting by 2s (Set B)
Bar graphs with a scale in 2s.
2.MD.D.10
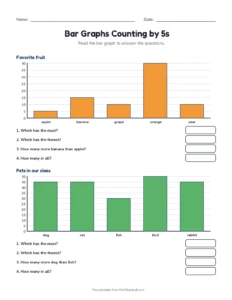
Bar Graphs Counting by 5s
Read bar graphs with a scale in 5s.
2.MD.D.10
Bar graphs: the parts of a graph
A bar graph has a few parts, and children who know them can read any graph. Wikipedia’s article on bar charts shows how old the idea is. The title says what the graph is about, the scale tells how much each line is worth, and the bars show the amounts. This table lists the five parts, with the example from the diagram above:
Part
What it does
On the diagram above
Title
says what the graph is about
Favorite Sport in Class 3B
Scale
the numbers along the side that tell how much each line is worth
0, 2, 4, … 16, counting by 2
Bars
one bar for each category, as tall as its amount
five bars
Category labels
the names under the bars
Soccer, Basketball, Swimming, Tennis, Baseball
Axis labels
say what the scale counts and what the categories are
Number of children, Sport
A good first step on every worksheet is to read the title and the labels aloud before looking at the questions. Children who skip this step often read the wrong scale, or answer a question about a different graph.
Bar graph worksheets: choosing and reading the scale
The bar graph worksheets in this pack use scales that count by 1, 2 and 5, and the scale is the most important thing to read. A scale that counts by 2 has labels 0, 2, 4, 6 and so on, and the lines between them are worth 1 each only if the grid shows them. Odd values land halfway between two labeled lines. This table shows what happens to the five bars of the survey data when the scale changes:
Scale counts by
First labels
Lines needed for a bar of 14
Bars that end on a line
Bars halfway between lines
Bars that need a closer look
1
0, 1, 2, 3, 4, 5, …
14
5
0
0
2
0, 2, 4, 6, 8, 10, …
7
3
2
0
5
0, 5, 10, 15, 20, 25, …
3
0
0
5
10
0, 10, 20, 30, 40, 50, …
2
0
0
5
With a scale that counts by 5, none of the five bars end on a labeled line, so every value must be read by looking at how far a bar is between two lines. This is the reason why the scale of 5s is saved for the last worksheet. The skip counting worksheets page helps children count by 2s, 5s and 10s before they meet these scales.
Reading bar graphs: top of the bar, straight across
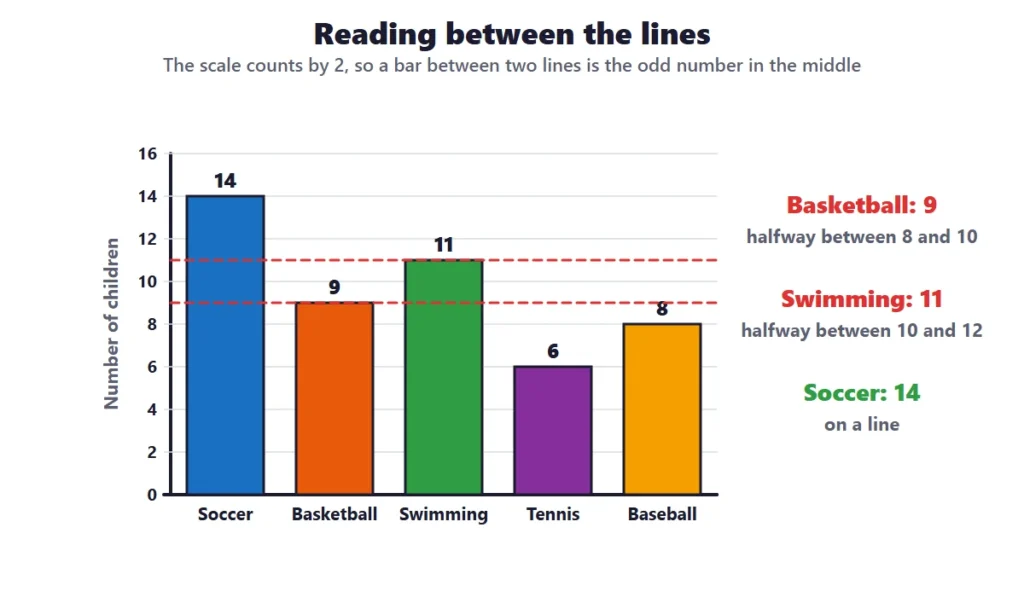
When reading bar graphs, children put a finger on the top of the bar and slide it straight across to the scale. The number at that level is the value of the bar. If the top of the bar is between two labeled lines, it is halfway between the two numbers, so a bar between 8 and 10 shows 9. This table turns the five votes into bars for a graph where each square is worth 2, and shows where each bar ends:
Sport
Votes in the table
Squares tall if each square is 2
Reading the scale
Soccer
14
7
on a line
Basketball
9
4.5
halfway between 8 and 10
Swimming
11
5.5
halfway between 10 and 12
Tennis
6
3
on a line
Baseball
8
4
on a line
The second column is the number in the survey, and the third is the height of the bar in squares. A bar of 4 1/2 squares is half a square above the 8 line, which is the 9 on the scale.
Bar graph questions: most, least and how many more
Most bar graph questions ask for one of five things: the tallest bar, the shortest bar, the value of one bar, the difference between two bars, or the total of all the bars. This table shows eight questions for the survey, with how to find each one and the answer:
Question
How to find it
Answer
Which sport is the most popular?
the tallest bar
Soccer, with 14
Which sport is the least popular?
the shortest bar
Tennis, with 6
How many children chose swimming?
read the top of the bar
11
How many more chose soccer than basketball?
14 − 9
5
How many fewer chose baseball than swimming?
11 − 8
3
How many chose soccer or tennis?
14 + 6
20
How many children were asked in all?
14 + 9 + 11 + 6 + 8
48
Which two sports together have the same as soccer?
9 + 6 = 15 and 8 + 6 = 14
Baseball and tennis (14)
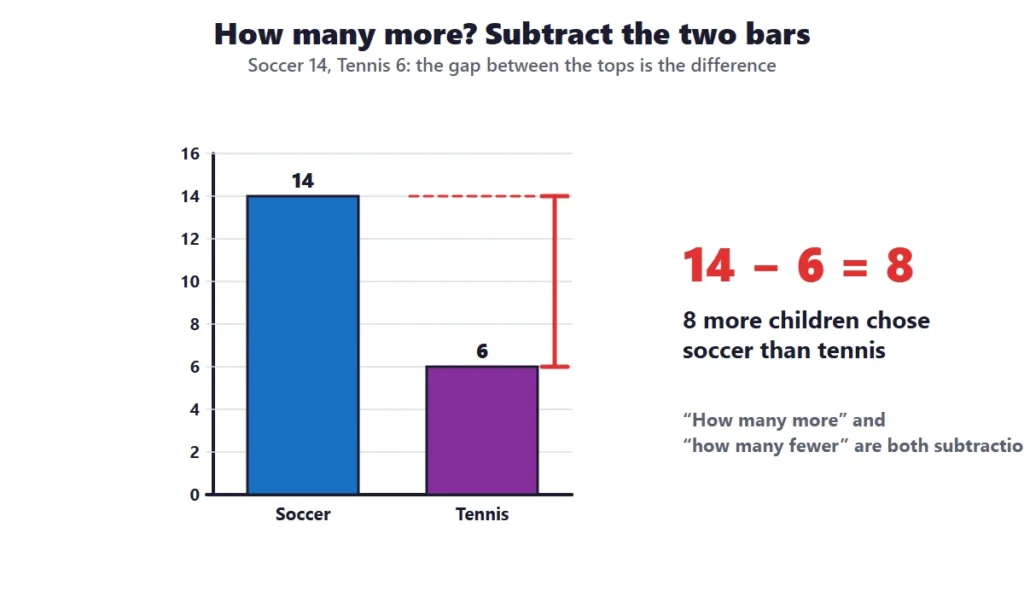
Questions about how many more or how many fewer are both subtractions. The gap between the top of one bar and the top of another is the difference, and children can see the gap if they draw a dotted line across from the taller bar. Every pair of bars gives two questions, so five bars give 10 pairs. This table lists all 10 differences for the survey:
Comparison
Working
Answer
Soccer and Tennis
14 − 6
8 more chose soccer
Soccer and Baseball
14 − 8
6 more chose soccer
Soccer and Basketball
14 − 9
5 more chose soccer
Swimming and Tennis
11 − 6
5 more chose swimming
Basketball and Tennis
9 − 6
3 more chose basketball
Soccer and Swimming
14 − 11
3 more chose soccer
Swimming and Baseball
11 − 8
3 more chose swimming
Baseball and Tennis
8 − 6
2 more chose baseball
Swimming and Basketball
11 − 9
2 more chose swimming
Basketball and Baseball
9 − 8
1 more chose basketball
Bar graph grade 2: the standards
For bar graph grade 2 the standard is 2.MD.D.10, which asks children to draw a picture graph and a bar graph with a single-unit scale for up to four categories, and to solve simple put-together, take-apart and compare problems using the graph. In grade 3, standard 3.MD.B.3 introduces scaled bar graphs, where each square is worth more than one, and one-step and two-step problems. The Common Core standards for grade 3 measurement and data describe the next step, and the tally charts and picture graphs page covers the way to collect the data first.
Every comparison in the table above is a compare problem, and every total is a put-together problem. The number of questions that can be asked grows quickly with the number of bars, as this table shows:
Categories
Pairs of bars to compare
Different “how many more” questions
2
1
1
3
3
3
4
6
6
5
10
10
6
15
15
8
28
28
Interpreting graphs worksheets: from a table to a bar
Interpreting graphs worksheets use three skills: reading a value, comparing values and drawing conclusions. The last one is the hardest, and the answer is a sentence such as “Soccer is the most popular sport, and tennis is the least.” Children can start with a table of data and decide which kind of display fits best. This table compares five ways of showing data:
A scale that counts by 2. Odd values sit halfway between lines.
Display
Best for
Example
Tally chart
collecting data as it comes in
counting votes in a class survey
Picture graph
showing small amounts with symbols and a key
pets owned by children in a group
Bar graph
comparing amounts, and large amounts
sports chosen by 48 children
Line plot
showing measurements along a line
lengths of pencils in inches
Table
listing exact numbers
the data before it is graphed
A bar graph is the best choice when the amounts are large or the categories are many, because a bar is quicker to read than a row of symbols. For a graph that shows how data changes over time, a line graph is used instead, and children meet this in grade 5.
A graph can mislead: where the scale starts
A fair bar graph starts its scale at 0. If the scale starts higher, a small difference looks big. For bars of 48 and 50, the shorter bar is 96% as tall as the taller one when the scale starts at 0, but only 80% when it starts at 40. This table shows what happens as the start moves up:
Scale starts at
The bar for 48 looks like
Fair or not
0
96% of the taller bar
fair
20
93% of the taller bar
misleading: the gap looks larger than it is
40
80% of the taller bar
misleading: the gap looks larger than it is
45
60% of the taller bar
misleading: the gap looks big
47
33% of the taller bar
misleading: the gap looks big
Children in grade 2 do not need this idea, but a short talk about it is a good way to show that graphs are made by people who choose the scale. A child who learns to check where the scale starts will read graphs in the news with more care.
Common mistakes with bar graphs
Most mistakes are about the scale or about the words in the question. This table shows five mistakes, what went wrong and the fix:
What the child says
What went wrong
The fix
Counts the grid lines to read the value
ignores the scale, which counts by 2
read the number on the scale at the level of the top of the bar
A bar ends between 8 and 10, so the answer is 8 or 10
thinks a bar must end on a labeled line
it is halfway, so the value is 9
“How many more” means add
reads the word more as plus
compare the two bars and subtract: 14 − 6 = 8
The tallest bar is the first bar
reads left to right and stops
compare the tops of all the bars before answering
The graph does not need a title
forgets what the graph shows
read the title and labels before the questions
Bar graphs word problems
Story problems use the facts that a bar graph shows. Ask children to draw the bars first, and to say which bars they are comparing before they calculate:
Word problem
Working
Answer
The bar for tennis ends at 6 and the bar for baseball ends at 8. How many fewer chose tennis?
8 − 6
2 fewer
Soccer got 14 votes and swimming got 11. How many more votes did soccer get?
14 − 11
3 more
Basketball got 9 votes and tennis got 6. How many votes did the two sports get together?
9 + 6
15 votes
A bar graph has 5 bars of 14, 9, 11, 6 and 8. How many children answered the survey?
14 + 9 + 11 + 6 + 8
48 children
Class 3B votes on a trip. Zoo gets 13 votes and museum gets 7. How many more voted for the zoo?
13 − 7
6 more
A scale counts by 5s and a bar ends halfway between 15 and 20. What is the value?
halfway between 15 and 20
17 or 18 (about 17 1/2)
Games and activities for bar graphs
Children learn bar graphs best when they play with it. These games use things that are found at home or in a classroom:
Class survey: ask the class a question, record the answers with tally marks and draw the bar graph
Graph detective: cover the labels of a bar graph and let a partner guess what it is about
Human bar graph: children stand in lines by their favorite color to make a living bar graph
Graph paper bars: color squares on graph paper to match a table of data
Dice bars: roll a die 30 times, tally the results and draw a bar graph
Spot the mistake: give a graph with an error in the scale and ask children to find it
Extra support and extra challenge with bar graphs
For children who need more support: start with a scale that counts by 1, and put a finger on the top of the bar and slide it across to the scale. Use a ruler or a strip of paper as a straight edge. Do the first set only, and say the question aloud before looking at the graph. Move to the scale of 2s when children read every bar correctly.
For children who need more challenge: ask for the total number of children without counting the bars one at a time, for a graph that is made from a table of their own data, and for a question that has two steps, such as how many more chose the top two sports than the bottom two. The scale of 5s worksheet is a good challenge.
How to tell that a child is ready to move on from bar graphs
The child reads the title, labels and scale before answering.
The child reads the value of a bar, including bars between two lines.
The child finds how many more or how many fewer by subtracting.
A short lesson is the best way to introduce bar graphs. This 20-minute plan can be used in a classroom, at a tutoring session or at home, and it uses the worksheets at the end:
Minutes
Activity
What to say or ask
0 to 3
Show a bar graph of the class’s favorite fruit and read the title together
What is this graph about? What does the scale count?
3 to 8
Read three bars with a finger, from the top of the bar to the scale
What is the value of this bar?
8 to 13
Ask “how many more” for two bars and show the gap with a dotted line
How do we find the difference?
13 to 18
Read a bar that is between two lines on a scale that counts by 2
Is it 8 or 10, or between?
18 to 20
Start a worksheet and check one answer
Check the scale.
Where bar graphs fits across the grades
No skill stands alone. This table shows what children learn before and after bar graphs, with the standard that goes with each step:
Grade
What children do
Standard or page
Grade 1
Organize and read data with up to three categories
Scaled bar graphs, and one-step and two-step problems
3.MD.B.3, this page
Grade 4
Line plots with fractions
4.MD.B.4
Grade 6
Statistics: data displays and averages
6.SP.B.4
This page is the main reading page for graphs. The whole sequence is on the graphing worksheets page.
Helping at home with bar graphs
Parents do not need to be experts to help with bar graphs. These suggestions work well, and each takes only a few minutes:
Make a bar graph of the family’s favorite meals with a sheet of graph paper.
Look for graphs in the newspaper and ask “what does the scale count?”.
Ask “which is the most?” and “how many more?” when children look at a graph.
Make a weather bar graph: count the sunny, cloudy and rainy days in a month.
Check the answers with the answer key and ask the child to explain one.
How to check progress in bar graphs
A teacher or parent can check progress with the answer key and a few questions. This table shows three common situations, what they mean and what to do next:
What you see
What it means
What to do next
The child reads the grid lines, not the scale
The scale is not yet part of the child’s picture of a graph
Write the number on every line of the scale, and read it aloud
The child gets 9 of 10 right in every set
The skill is secure
Move on to scaled picture graphs and tally charts
The child cannot read bars that are between two lines
The idea of halfway on a scale is new
Use a number line to show that 9 is between 8 and 10
A five-day plan for bar graphs
Most children need about a week of short sessions for bar graphs. This plan follows the order of the worksheets on this page:
At the top of the bar, straight across on the scale at the side.
What if the top of a bar is between two lines?
It is halfway between the two numbers on the scale, like 5 between 4 and 6.
What is a scale on a bar graph?
The scale is the row of numbers along the side of the graph. It tells how much each line is worth, for example 1, 2 or 5. You read a bar by finding the number on the scale at the height of its top.
How do you find how many more on a bar graph?
Read the values of the two bars and subtract the smaller from the larger. On a graph where soccer has 14 and tennis has 6, 14 − 6 = 8, so 8 more chose soccer.
What grade learns bar graphs?
Bar graphs are introduced in grade 2 with a single-unit scale, and grade 3 uses scaled bar graphs where each square is worth more than one. Grade 1 children read simple graphs with up to three categories.