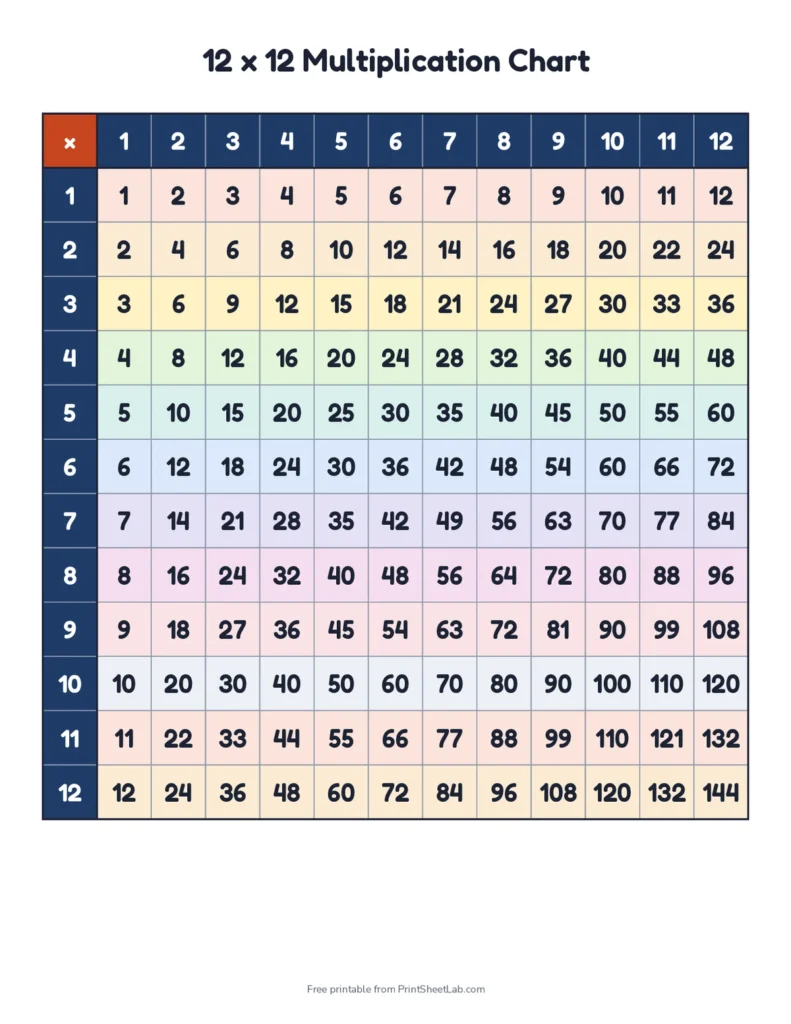
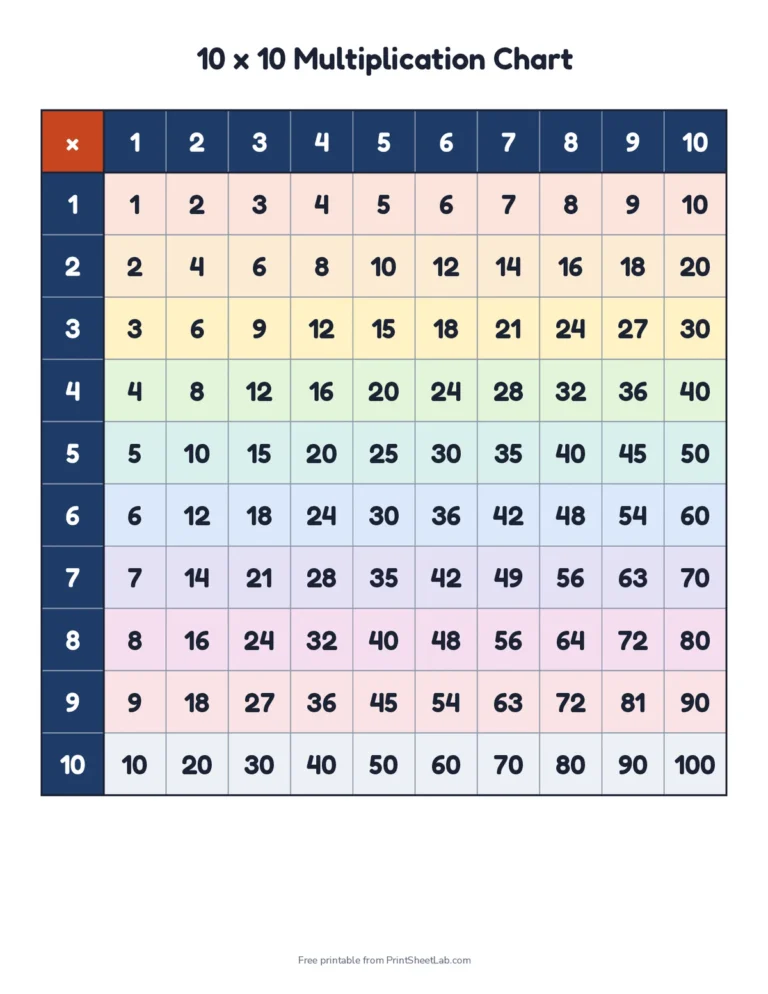
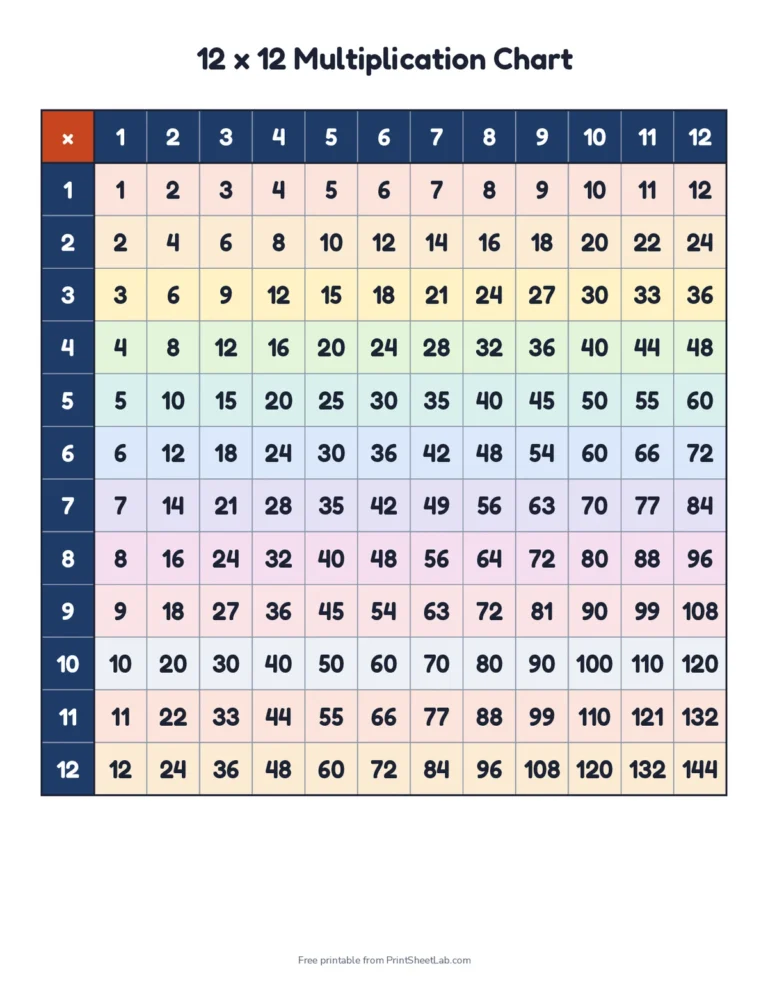
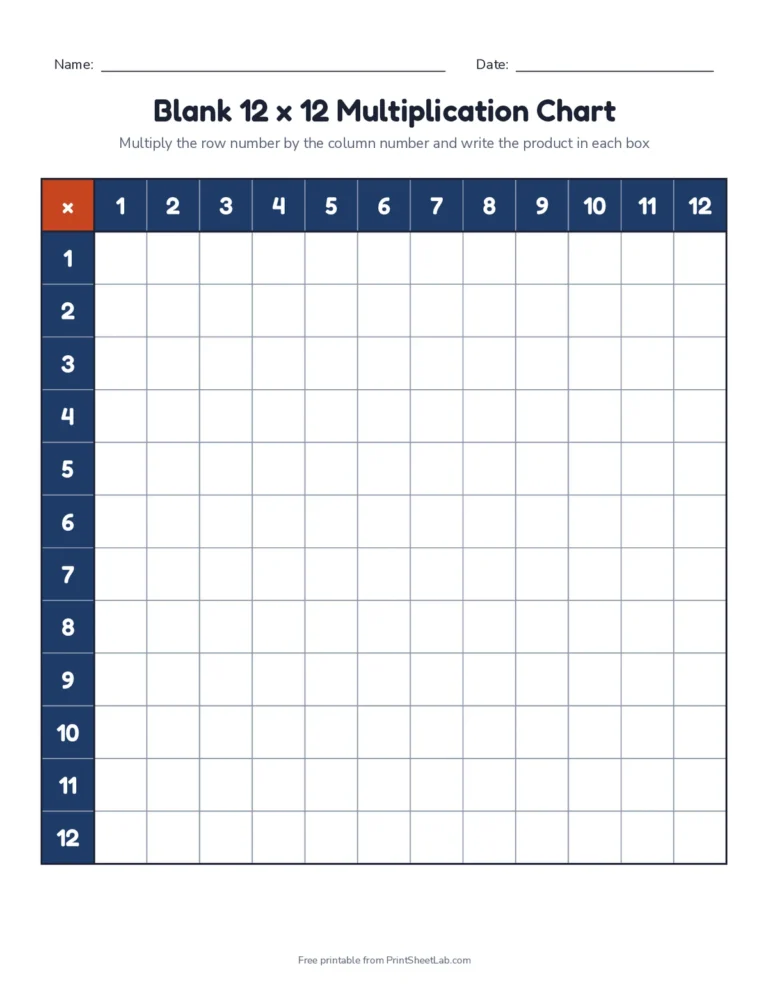
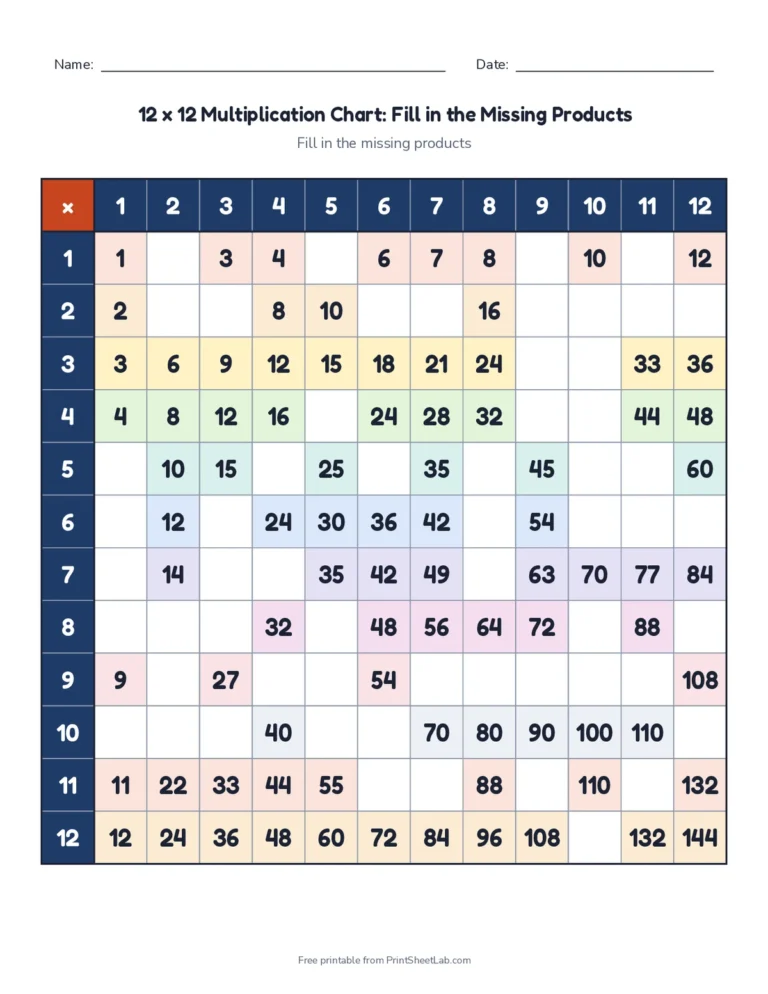
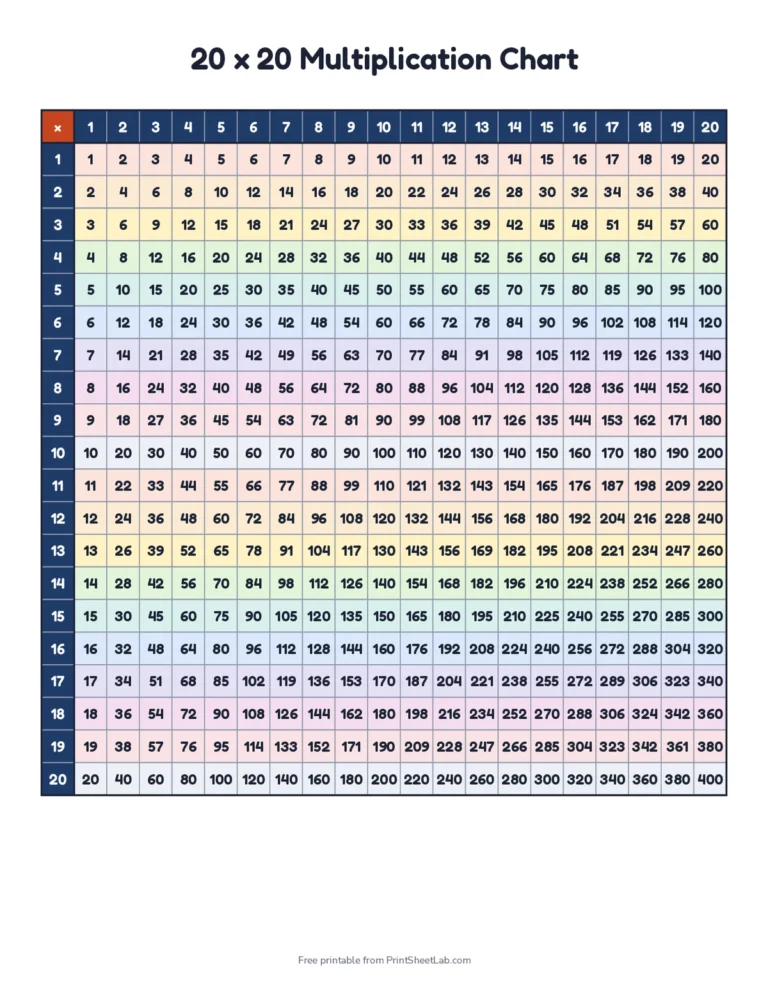
A multiplication chart (also called a times table chart or times chart) is a grid that shows the product of every pair of numbers in its rows and columns. Make yours with the generator above: a free printable multiplication chart from 10 × 10 (the times chart 1 to 100) up to 12 × 12, 15 × 15 or 20 × 20, in color or black and white, a blank multiplication chart to fill in, or a chart with missing products and an answer key. Each times table chart is drawn to fit US Letter or A4 paper exactly. Pin a printable multiplication chart in a binder or on the wall, and use the blank times table chart once the facts start to stick.
Interactive multiplication chart
Point at or tap any box to light up its row and column and see the fact. Press Hide 15 products to turn the chart into a quick quiz: work out each hidden product, then click to check.
Ready-to-print multiplication charts (PDF)
Tap a times table chart to get its PDF. Want a 15 × 15 grid or a softer palette? Customize sends it to the generator.
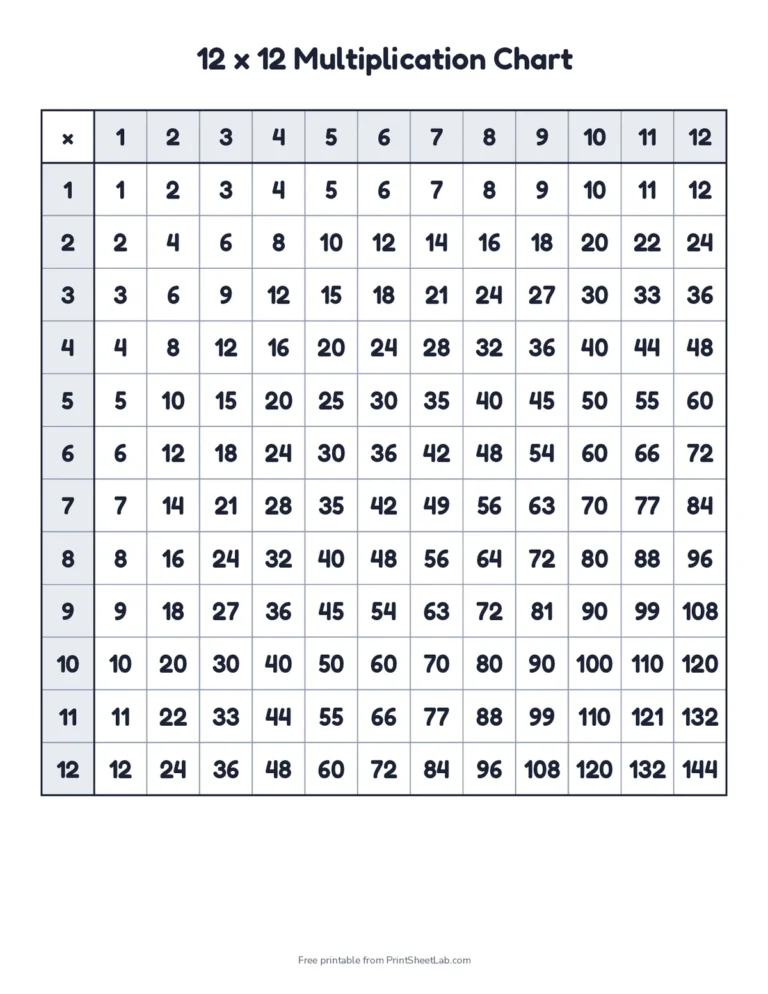
How to read a multiplication chart
- Find the first number in the left column (the dark blue column).
- Find the second number in the top row.
- Follow the row across and the column down until they meet. The number in that box is the product.
- Example: for 7 × 8, go across row 7 and down column 8. They meet at 56, so 7 × 8 = 56.
It works backwards for division too: to find 56 ÷ 8, go down column 8 until you reach 56, then look left. The row number, 7, is the answer.
Patterns in the times table chart
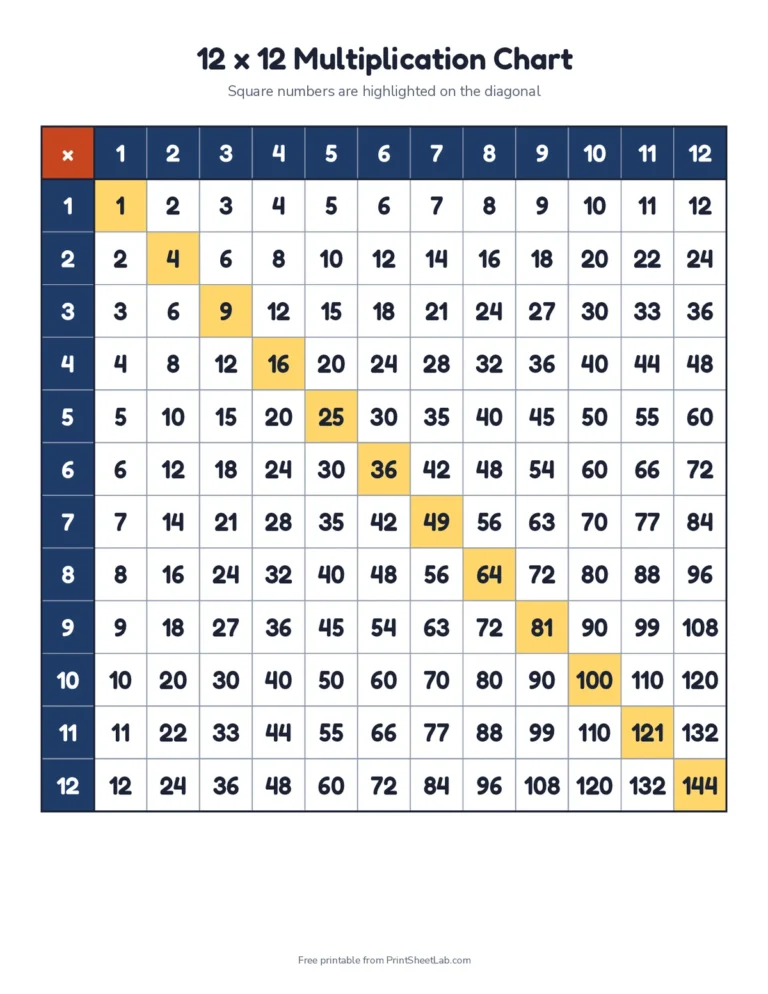
- It is symmetrical. The chart is a mirror image across the diagonal because 3 × 7 and 7 × 3 are the same. That means you only need to learn about half the facts.
- Square numbers sit on the diagonal: 1, 4, 9, 16, 25, 36, 49, 64, 81, 100, 121 and 144.
- The 2s are doubles and the 4s are doubles of doubles: 4 × 6 is double 12, which is 24.
- The 5s always end in 5 or 0, and the 10s always end in 0.
- The 9s (up to 9 × 10) have digits that add up to 9: 18, 27, 36, 45 and so on. The tens digit goes up by one while the ones digit goes down by one.
- The 11s repeat the digit up to 11 × 9: 11, 22, 33 up to 99.
- Every row doubles the row halfway up: the 6s are double the 3s, the 8s are double the 4s.
- A product is odd only when both numbers are odd. Every other product is even.
10 × 10, 12 × 12 or 20 × 20: which chart?
| Chart | Facts | Different facts to learn | Good for |
|---|---|---|---|
| 10 × 10 (times chart 1 to 100) | 100 | 55 | Grade 3: all products of two one-digit numbers |
| 12 × 12 | 144 | 78 | Grades 3 and 4, and schools that teach tables to 12 |
| 15 × 15 | 225 | 120 | Extra challenge and mental math |
| 20 × 20 | 400 | 210 | Older students, squares to 400 and patterns |
“Different facts” counts each pair once, because the chart is symmetrical: 3 × 7 and 7 × 3 are one fact to learn.
How to memorize the times tables with a chart
- Start with the easy rows: 0s, 1s, 2s, 5s and 10s. They already cover over half of a 10 × 10 chart.
- Color what you know. Shade each fact once it feels easy. Watching the white boxes shrink is great motivation.
- Use the flip: once you know 3 × 8, you also know 8 × 3.
- Learn the squares on the diagonal next. They are anchors for nearby facts: 7 × 8 is one more 7 than 7 × 7.
- Finish with the hard few: 6 × 7, 6 × 8, 7 × 8, 7 × 9 and 8 × 9 are the facts most children find hardest.
- Test with a blank chart and time how long it takes to fill in. Try to beat your time each week.
Times table games to play with the chart
- Chart bingo: call out facts (“six times four”) and cover the product on your chart.
- Race the row: read a whole row aloud as fast as you can without mistakes.
- Missing products: print a chart with 40% missing and fill in the gaps before checking with the answer key.
- Find the pattern: highlight multiples of 3, then 6, then 9, and describe what you notice.
- Division detective: call out a product and a factor (“48 and 6”) and find the missing number.
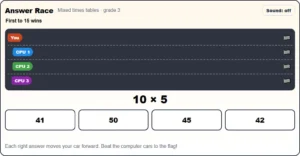
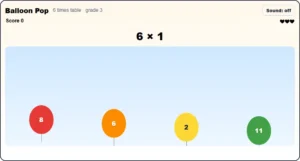
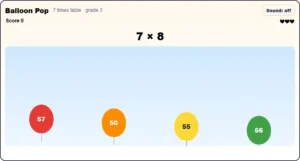
Practice it as a game
Free online games for the same skill: balloon pop, memory match, races and more. No sign-up.
Frequently asked questions
13 quick answers
Where should I keep a printable multiplication chart?
A copy in the homework folder and one on the fridge or classroom wall works well. Children look up a fact, say it aloud, and gradually stop needing the chart.
What is a multiplication chart?
It is a grid with numbers along the top and down the side. The box where a row and a column meet shows their product, so the whole times table fits on one page.
What is a times chart 1 to 100?
It is a 10 × 10 grid of products. Its products go from 1 up to 100, covering every multiplication fact of two numbers from 1 to 10.
Should I use a 10 × 10 or a 12 × 12 multiplication chart?
The Common Core grade 3 standards expect children to know products of two one-digit numbers, which a 10 × 10 chart covers. Many schools also teach the 11s and 12s, so a 12 × 12 chart is the most popular choice.
How many facts are on a 12 × 12 multiplication chart?
There are 144 boxes, but because 4 × 7 and 7 × 4 are the same fact, there are only 78 different facts to learn.
What are square numbers on a multiplication chart?
Square numbers are a number times itself, such as 4 × 4 = 16. On the chart they run diagonally from the top left corner to the bottom right.
How do you use a multiplication chart for division?
Find the divisor in the top row, go down that column to the dividend, then look across to the left column. That number is the answer. For 63 ÷ 9, go down column 9 to 63 and look left to find 7.
What grade learns the multiplication chart?
Children start multiplication in grade 2 with arrays, learn all facts to 10 × 10 in grade 3, and use the facts for multi-digit multiplication and division in grades 4 and 5.
Is using a chart cheating?
No. A chart is a learning tool. Using it to spot patterns and check answers helps children remember facts, and the aim is to rely on it less over time.
What is a blank multiplication chart for?
Filling in a blank chart shows which facts a child knows and which still need practice. Timing it each week makes progress easy to see.
Why does a multiplication chart start at 0?
Some charts include a 0 row and column to show that any number times 0 is 0. You can choose to start at 0 or 1 in the generator.
Can I print the chart in black and white?
Yes. Choose Black and white in the generator to save ink. Highlighted patterns print as light gray.
Is it free to print on A4?
Yes. You can print as many multiplication charts as you like for family or school, without creating an account. Choose Letter or A4 and the chart is drawn for that paper.
More multiplication practice
- Times tables worksheets for every table from 2 to 12.
- Multiplication worksheets from arrays to 2-digit by 2-digit.
- Multiplication facts to 10 × 10 and to 12 × 12.
- Division worksheets that use the same facts backwards.
- 3rd grade math worksheets, the multiplication year.
- Hundreds chart for skip counting, the first step to the times tables.
- Skip counting for kids: how to teach counting by 2s to 12s before the times tables.
- Multiplication flash cards to print double-sided.