A weighted mean calculator finds an average in which some values count more than others. Enter each value with its weight, such as a score and its credit hours, or the number of responses at each point of a Likert scale. The weighted mean calculator multiplies, adds and divides by the total weight, and shows the plain mean beside it.
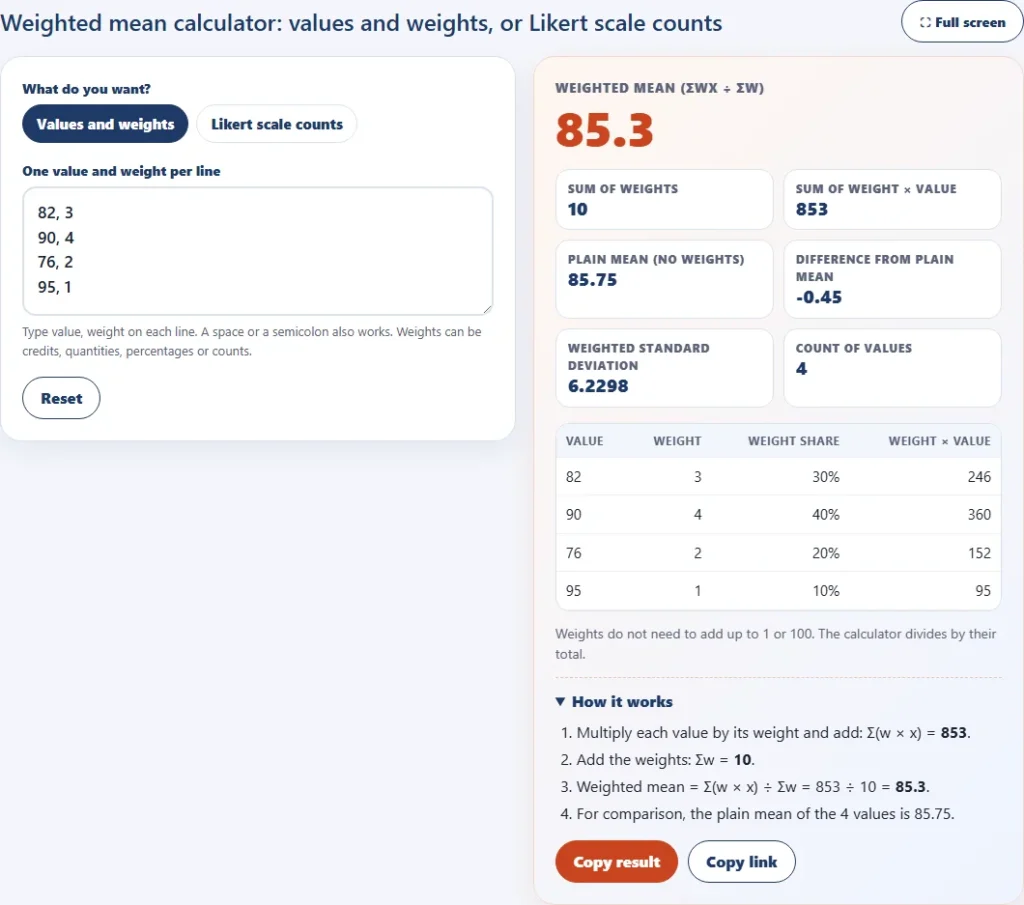
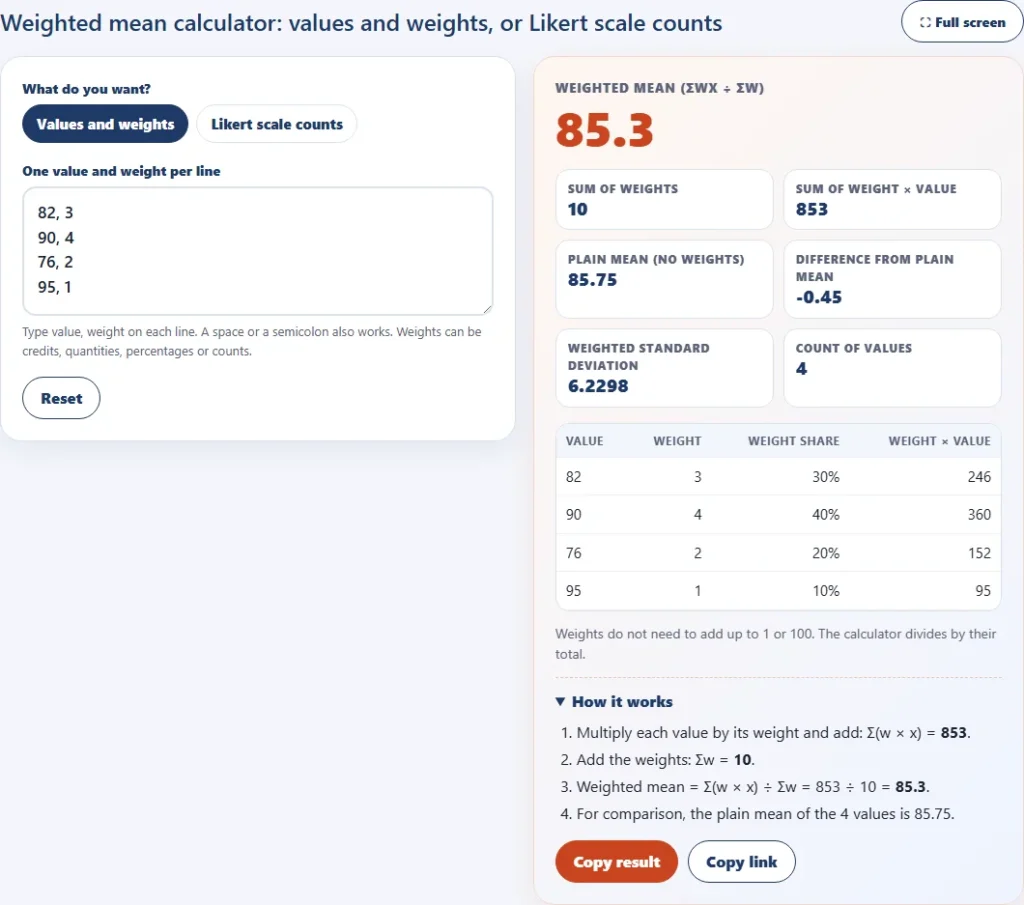
Quick answer: Weighted mean = Σ(weight × value) ÷ Σweights. For scores of 82, 90, 76 and 95 with weights 3, 4, 2 and 1, it is (246 + 360 + 152 + 95) ÷ 10 = 85.3, while the plain mean is 85.75.
How to use the weighted mean calculator
- Choose Values and weights, or Likert scale counts.
- For values and weights, type one pair per line, for example 85, 3. Use a comma, a space or a semicolon between them.
- For a Likert scale, pick the number of points and type how many responses each score received.
- Read the weighted mean, the sum of weights, the plain mean and the table.
- Open How it works for each step, then copy the result or the link.
The weighted mean calculator runs in your browser and keeps your data on your device.
Weighted mean formula
Wikipedia describes the weighted arithmetic mean as similar to an ordinary mean, except that instead of each data point contributing equally, some data points contribute more than others. If all the weights are equal, the weighted mean is the same as the arithmetic mean.
- Weighted mean = (w1x1 + w2x2 + … + wnxn) ÷ (w1 + w2 + … + wn)
- x is each value, and w is its weight.
- Weights do not have to add up to 1 or 100. Only their relative size matters, because the formula divides by their total.
- If every weight is 1, the weighted mean equals the plain mean.
How to calculate weighted mean: worked examples
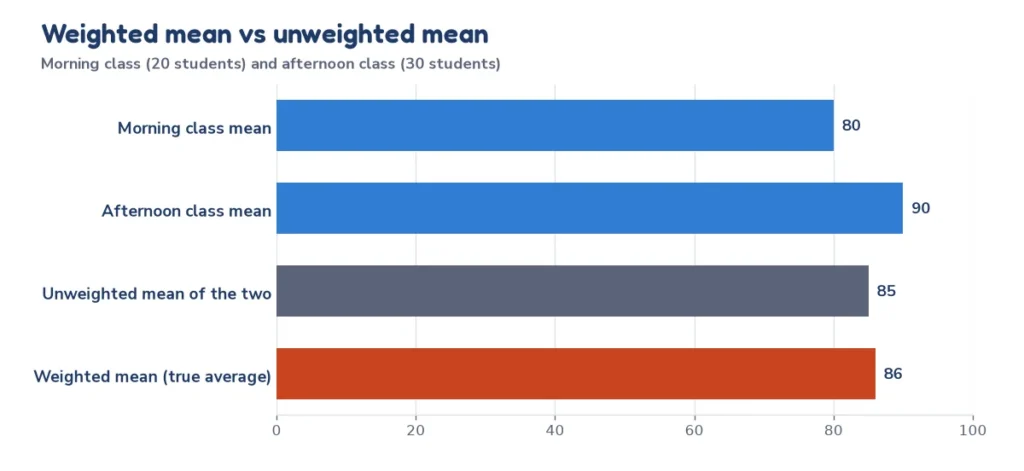
Wikipedia gives a clear example. A morning class has 20 students with a mean grade of 80, and an afternoon class has 30 students with a mean of 90. The unweighted mean of the two class means is 85, but that ignores the class sizes. Weighting by size gives (20 × 80 + 30 × 90) ÷ 50 = 86, which is the average of all 50 students.
| Example | Value (weight) | Sum of weight × value | Sum of weights | Weighted mean |
|---|---|---|---|---|
| Class means by class size | 80 (20), 90 (30) | 4300 | 50 | 86 |
| Course scores by credits | 82 (3), 90 (4), 76 (2), 95 (1) | 853 | 10 | 85.3 |
| Fuel price per gallon by gallons | $3.40 (10), $3.60 (15), $3.20 (5) | 104 | 30 | 3.4667 |
| Survey scores by group size | 4.2 (120), 3.6 (80), 3.9 (50) | 987 | 250 | 3.948 |
| Test average by weight | 88 (0.5), 74 (0.3), 95 (0.2) | 85.2 | 1 | 85.2 |
Weighted mean vs weighted average
Weighted mean and weighted average are the same calculation. Statistics and research texts usually say weighted mean, while everyday, finance and school contexts say weighted average. For a course grade with category weights such as 40% exams and 30% homework, use the weighted grade calculator. Use this weighted mean calculator when you have values and weights or counts, and the weighted grade calculator when you have course categories.
Weighted mean calculator for Likert scale data
Surveys and research papers often report the weighted mean of a Likert scale item. Each point on the scale gets a score, such as 5 for strongly agree down to 1 for strongly disagree, the score is multiplied by the number of responses, and the total is divided by the number of respondents. In the Likert scale counts mode, enter the number of responses for each score.
| Score | Responses | Score × responses |
|---|---|---|
| 5 Strongly agree | 12 | 60 |
| 4 Agree | 25 | 100 |
| 3 Neutral | 18 | 54 |
| 2 Disagree | 7 | 14 |
| 1 Strongly disagree | 3 | 3 |
| Total | 65 | 231 |
The weighted mean is 231 ÷ 65 = 3.554. To describe it in words, researchers split the scale into equal bands. The width of each band is the number of intervals divided by the number of points. For a 5-point scale, (5 − 1) ÷ 5 = 0.80. The weighted mean calculator reports the band for your result, and the bands are a convention, so state them in your report.
| Scale | Band width | Bands from low to high |
|---|---|---|
| 3-point | 0.67 | 1.00 to 1.67, 1.68 to 2.33, 2.34 to 3.00 |
| 4-point | 0.75 | 1.00 to 1.75, 1.76 to 2.50, 2.51 to 3.25, 3.26 to 4.00 |
| 5-point | 0.80 | 1.00 to 1.80, 1.81 to 2.60, 2.61 to 3.40, 3.41 to 4.20, 4.21 to 5.00 |
| 6-point | 0.83 | 1.00 to 1.83, 1.84 to 2.67, 2.68 to 3.50, 3.51 to 4.33, 4.34 to 5.17, 5.18 to 6.00 |
| 7-point | 0.86 | 1.00 to 1.86, 1.87 to 2.71, 2.72 to 3.57, 3.58 to 4.43, 4.44 to 5.29, 5.30 to 6.14, 6.15 to 7.00 |
Weighted mean statistics: frequencies and grouped data
In statistics, the frequencies of a table are weights. For grouped data, use the middle of each class as the value and the frequency as the weight. The mean of the grouped table is an estimate, because the exact values inside each class are not known.
| Class | Midpoint (x) | Frequency (f) | f × x |
|---|---|---|---|
| 0 to 10 | 5 | 4 | 20 |
| 10 to 20 | 15 | 7 | 105 |
| 20 to 30 | 25 | 9 | 225 |
| 30 to 40 | 35 | 5 | 175 |
| Total | 25 | 525 |
The estimated mean is 525 ÷ 25 = 21. Enter each midpoint and frequency as a line in the weighted mean calculator and you get the same answer, including the sum of weights and the plain mean.
Weighted mean in Excel and Google Sheets
Put the values in column A and the weights in column B. The weighted mean is =SUMPRODUCT(A2:A5,B2:B5)/SUM(B2:B5). SUMPRODUCT multiplies each value by its weight and adds the results, and SUM adds the weights. The same formula works in Google Sheets. For a Likert scale, put the scores 1 to 5 in A and the counts in B.
Weighted mean example with steps: a cost basis
An investor buys shares at three prices: 10 shares at $50, 20 shares at $55 and 5 shares at $62. The average cost per share is a weighted mean of the prices, with the number of shares as the weights. A plain mean of the three prices would be wrong, since it ignores the size of each purchase.
| Purchase | Price (value) | Shares (weight) | Weight × price |
|---|---|---|---|
| First | $50.00 | 10 | $500.00 |
| Second | $55.00 | 20 | $1,100.00 |
| Third | $62.00 | 5 | $310.00 |
| Total | 35 | $1,910.00 |
The weighted mean is $1,910.00 ÷ 35 = $54.57 per share. The plain mean of the prices is $55.67, so ignoring the weights overstates the cost by about $1.10 a share. Type the three lines into the weighted mean calculator to check it.
Weights as percentages and shares
The weight share column in the weighted mean calculator turns any weights into percentages. Credits of 3, 4, 2 and 1 become 30%, 40%, 20% and 10%, which is why a four-credit course has four times the pull of a one-credit course. Percent weights are just weights that already add up to 100, so you can enter them directly: scores of 88, 74 and 95 with weights of 50, 30 and 20 give 88 × 0.5 + 74 × 0.3 + 95 × 0.2 = 85.2.
Weighted mean vs median and mode
The weighted mean is still a mean, so it is pulled by extreme values just like the plain mean, and a large weight on an outlier pulls harder. The median and mode do not use weights in the same way. When a data set has outliers or a skewed shape, report the weighted mean together with the distribution, for example the share of each response.
Weighted standard deviation and spread
The weighted mean is a center, and it has a matching spread. The weighted mean calculator also shows the weighted standard deviation, computed as the square root of Σw(x − mean)² ÷ Σw. It treats the weights as frequencies of the whole group, so use a sample standard deviation formula if your data are a sample and the weights are reliability weights.
Common mistakes with weighted means
- Averaging the averages without weights, as in the class example where 85 is not the true average.
- Using percentages as values when the weights are the sizes behind them. Weight by the counts.
- Forgetting that weights are divided by their total, so adding extra zeros to all weights changes nothing.
- Mixing a weight that means size with one that means importance in the same list.
- Treating a Likert scale mean as exact. It is an ordinal scale, so report the distribution too.
Frequently asked questions
10 quick answers
What is a weighted mean?
A weighted mean is an average where each value has a weight that sets how much it counts. It equals the sum of weight times value divided by the sum of weights.
How do you calculate the weighted mean?
Multiply each value by its weight, add the products, and divide by the sum of the weights. For 82, 90, 76 and 95 with weights 3, 4, 2 and 1, the result is 85.3.
Is a weighted mean the same as a weighted average?
Yes. They are the same calculation. Statistics uses weighted mean and everyday use prefers weighted average.
Do the weights have to add up to 100 or 1?
No. Only their relative sizes matter, since the formula divides by the total of the weights.
How do I find the weighted mean for a Likert scale?
Multiply each score by the number of responses at that score, add the products, and divide by the number of respondents.
What does a weighted mean of 3.5 on a 5-point scale mean?
It falls in the 3.41 to 4.20 band, which researchers commonly call agree. The bands are a convention, so state the ones you use.
How do I calculate a weighted mean in Excel?
Use =SUMPRODUCT(values,weights)/SUM(weights). The same works in Google Sheets.
When is the weighted mean different from the plain mean?
When the weights differ. If all weights are equal, the two are the same.
Can a weight be zero?
Yes. A zero weight leaves the value out. At least one weight must be above zero.
Can I use the weighted mean calculator for grouped data?
Yes. For a frequency table, the frequency is the weight. For grouped data, use the class midpoint as the value.
Related calculators
- Weighted grade calculator for course grades with category weights
- Mean, median and mode calculator for unweighted averages
- Standard deviation calculator for the spread of a list
- Percentage calculator for shares and percent change
- All free calculators
Sources and further reading
- Weighted arithmetic mean (Wikipedia): the definition and the class-size example
- Likert scale (Wikipedia): how Likert items are scored
- Mean (Wikipedia): arithmetic mean and related averages
This page is for learning and general calculation. Last reviewed: October 2026.